Construction Data Analytics: Connecting BIM Data with Power BI
Analyzing and Visualizing BIM Data with Power BI
The Architecture, Engineering, and Construction industry increasingly leverages data to make informed decisions, innovate, and achieve more efficient outcomes. The ability to convert complex and abundant data into understandable and actionable visuals plays a significant role in this process. For this purpose, construction data analytics and visualization tools, such as Power BI, have become indispensable assets.
Data visualization tools can help you gain insights from your Autodesk Construction Cloud data. But integrating these two platforms and optimizing their functionalities can be challenging. Here, Sarah, the powerful data connector web app developed by e-verse, comes into play.
In this guide, we’ll walk you through a comprehensive process of understanding your BIM data, setting up Power BI, importing your Autodesk Construction Cloud data into Power BI, creating your first visualization, and using filters and tools in Power BI to enhance your data visualization.
Understanding Your Data Analytics in Construction
Before diving into it, it’s critical to understand the structure and nature of your BIM data. Autodesk Construction Cloud provides a wealth of information, including data about designs, models, project progress, and more. Understanding this data’s complexity and structure is the first step toward effective data visualization. As a former BIM manager, I needed ways to access and leverage BIM data for business intelligence. It took a lot of work to get insights from it outside of an engineering perspective in and out of specialized software like Revit, not to mention aggregating data from multiple models to grasp more significant strategic insights.
Sarah is a bridge in construction data analytics, allowing users to connect to their Autodesk Construction Cloud Hub from any device and select the project and version of the model they want to work with. It processes the selected model, enabling users to choose the categories they want to export. The result is a CSV file containing the selected data, ready for visualization.

Getting Started with Sarah
Before diving into Power BI, let’s get started with Sarah.
We’ll dive deeper into it in the points that follow, but here’s an overview of the Sarah user interface:
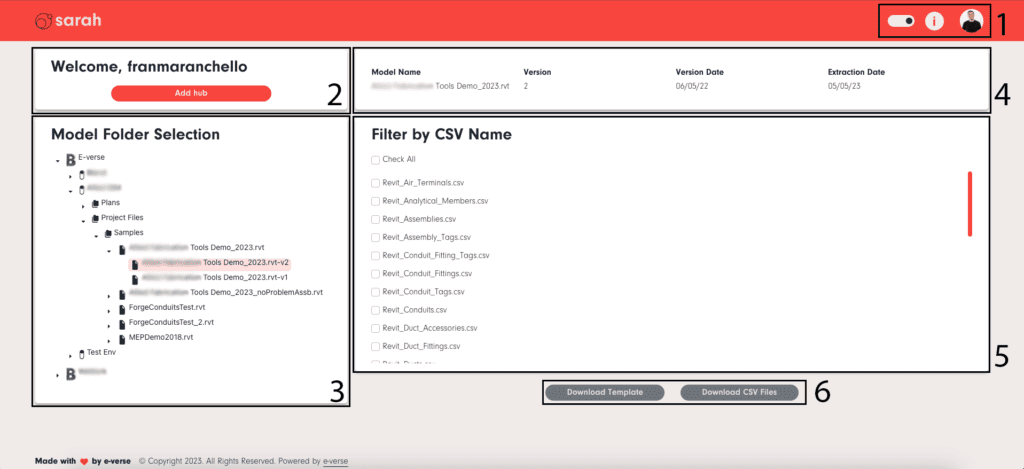
- User Settings: view the account you’re using, log out, and manage your subscription settings.
- Account and Hub Panel: add your Hubs here to enable model browsing!
- Model Browser: select the Hub, model, and version you want to work with.
- Model Information: information about the selected model.
- Data Selection: choose the data you want to export.
- Downloads: download the Power BI template and the CSV data from point 5.
Here’s how you can set it up:
- Log in with your Autodesk account: Sarah integrates with Autodesk Construction Cloud platform, so you’ll need to log in to your Autodesk account and authorize the app to access your data.
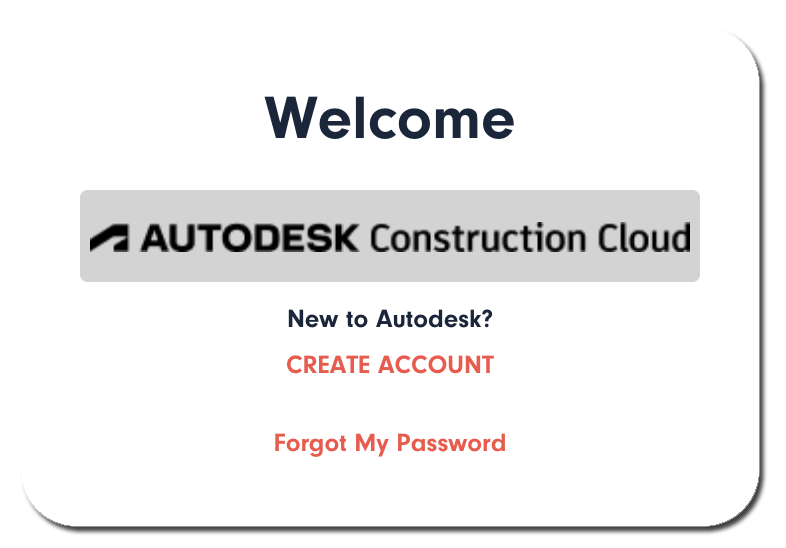
2. Add your Hubs: Once logged in, you’ll need to add your Hubs by clicking on Add Hub. Each Hub should contain different projects; you can select the one you want to work on.

3. Select the model version you want to process: Browse and select the correct project version before processing in the Model Folder Selection section.
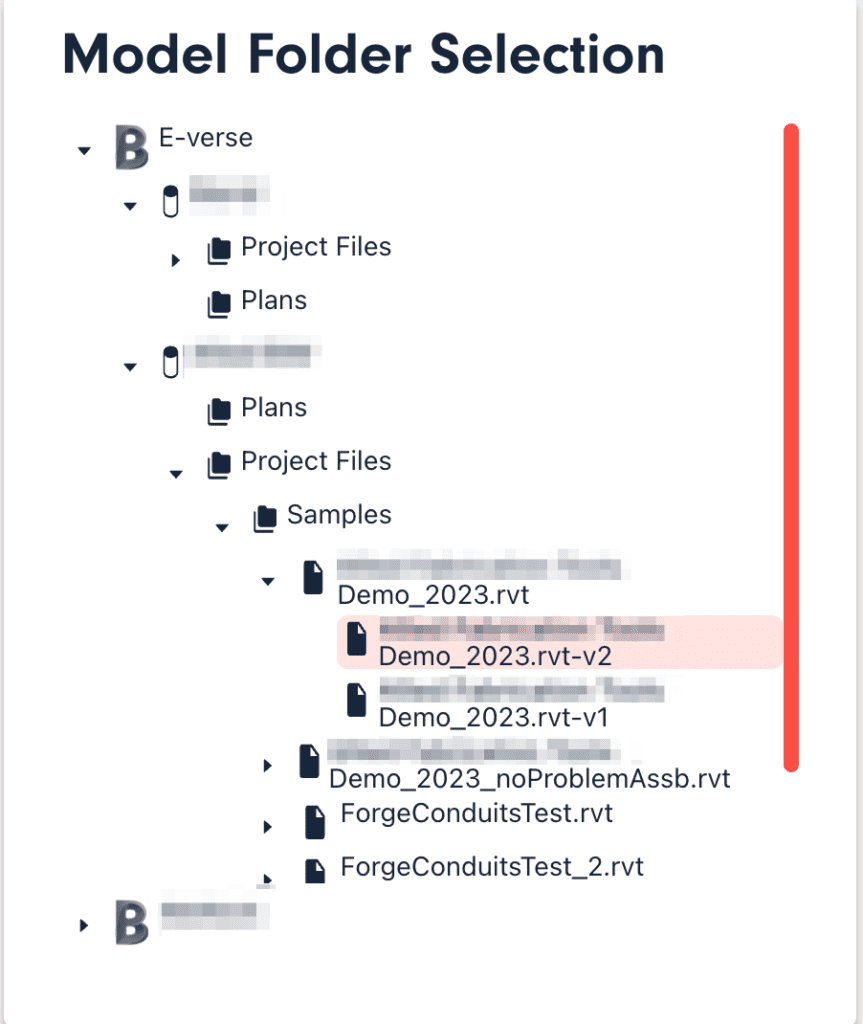
As you can see, we designed Sarah to make accessing your Autodesk Construction Cloud data as straightforward as possible, helping you to get your data ready for visualization.
Exporting BIM Data with Sarah
After setting up Sarah, the next step is to export the data you want to visualize. Here’s how you can do it:
- Select categories to export: Sarah allows you to choose the types of data you want to export. You can go through the checklist and select the ones you need, or select all if you prefer. This feature ensures you have complete control over the data you want to visualize, making the process more efficient and tailored to your needs.
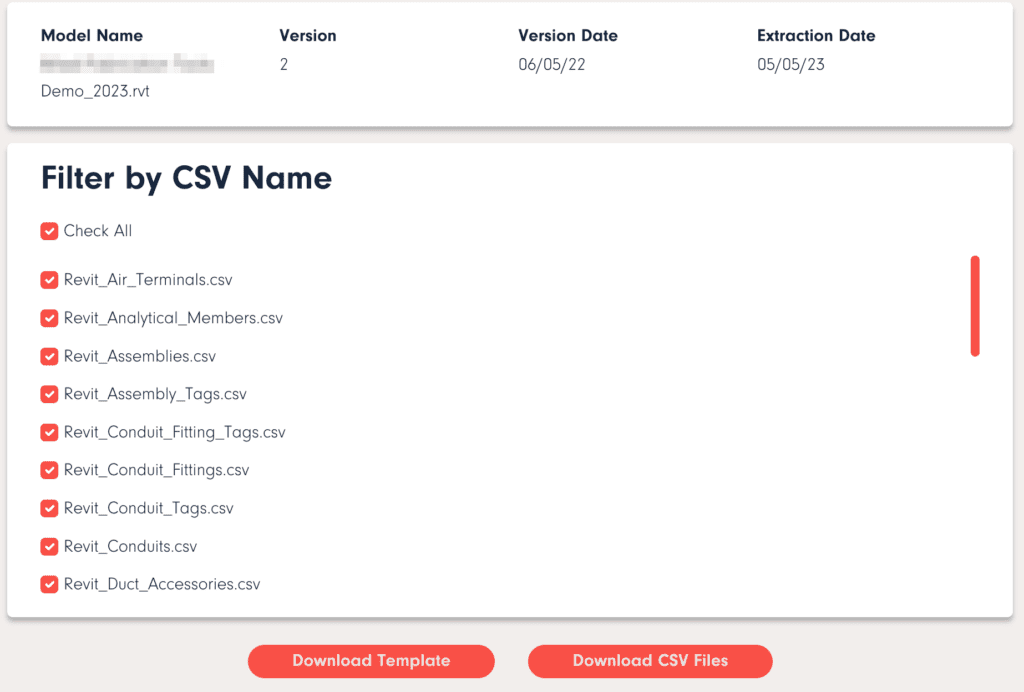
2. Download the PowerBI Template: Click “Download Template” and keep the downloaded .pbix file for later.
3. Export CSV files: Once you’ve selected your categories, click “Download CSV Files”. Sarah will then provide you with a compressed file containing the chosen CSVs.
You should see something like this:

A .zip file containing all the CSVs with your model data and the Template file.
Setting up Power BI for Data Visualization
Now it’s time for analyzing and visualizing data with Power BI. If you’re new to this solution, don’t worry; it’s a user-friendly tool designed to make data visualization as easy as possible. Once you’ve installed it, you can import the CSV files you exported from Sarah, allowing you to start creating visualizations using your Autodesk Construction Cloud data.
The first step in using Power BI is installing its desktop version. Once installed, you can open a template and start importing your data.
Sarah makes this process easier by providing Power BI templates you can use directly, giving users a jump start on their data visualization journey:
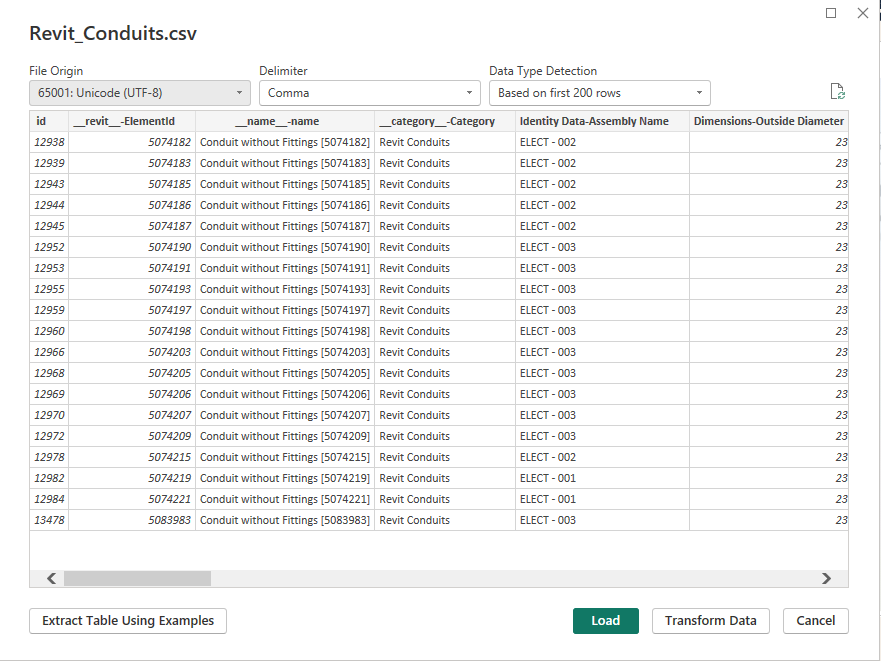
Importing Autodesk Construction Cloud data into Power BI is a straightforward process. After exporting the required data from your Autodesk Construction Cloud Hub, you can import the CSV file into Power BI. Click on “Get Data” from the “Home” tab, select “Text/CSV” from the drop-down, and locate your CSV file. Sarah’s features ensure a smooth process, adding convenience and efficiency to your workflow.
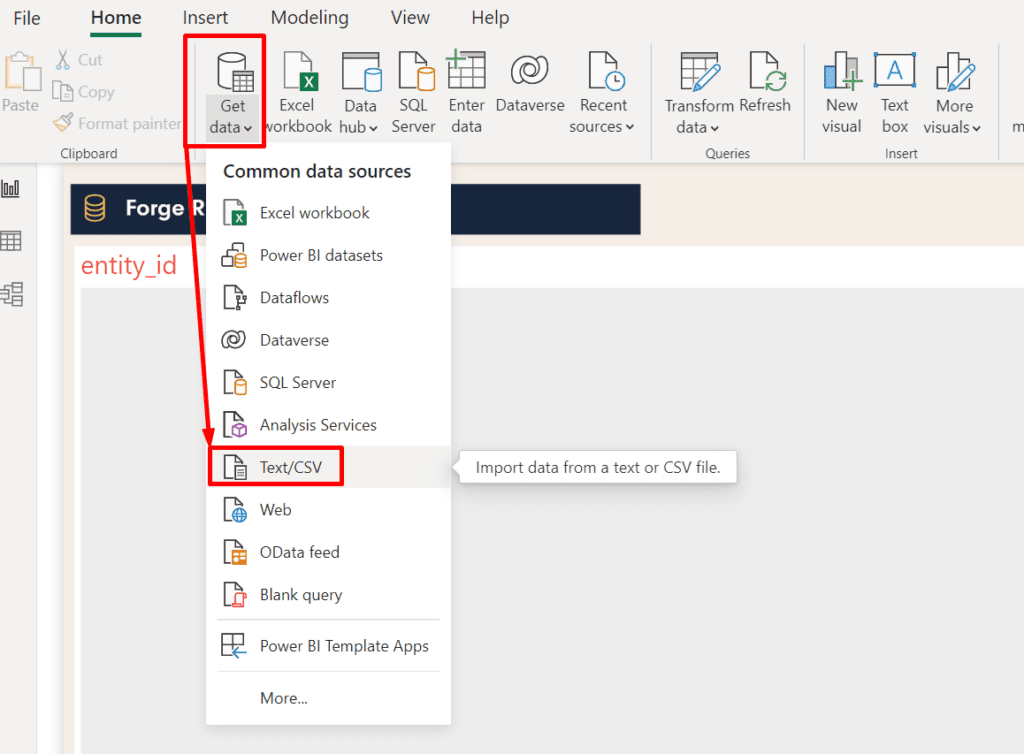
After that, you can preview the CSV data and click on Load. A significant highlight here is that you can add and aggregate data from as many models as you want, allowing for broader, company-wide analysis.
Creating Your First Autodesk Construction Cloud Data Visualization
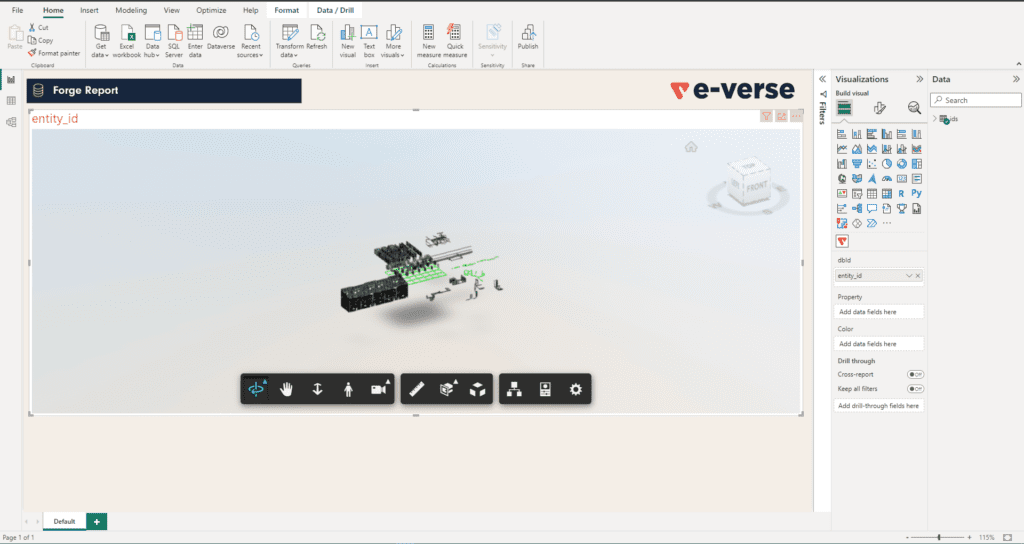
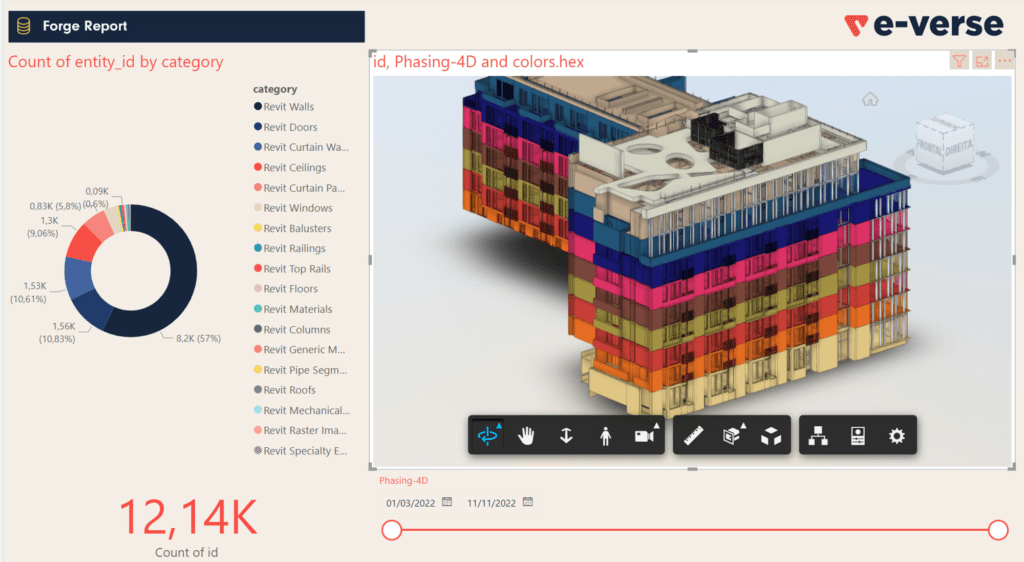
You can now start creating visualizations with your Autodesk Construction Cloud data. Power BI provides various visualization options, from simple bar graphs and pie charts to complex waterfall and treemap charts. Select the fields you want to visualize or drag and drop them onto the report area, changing the type of visualization from the top pane.
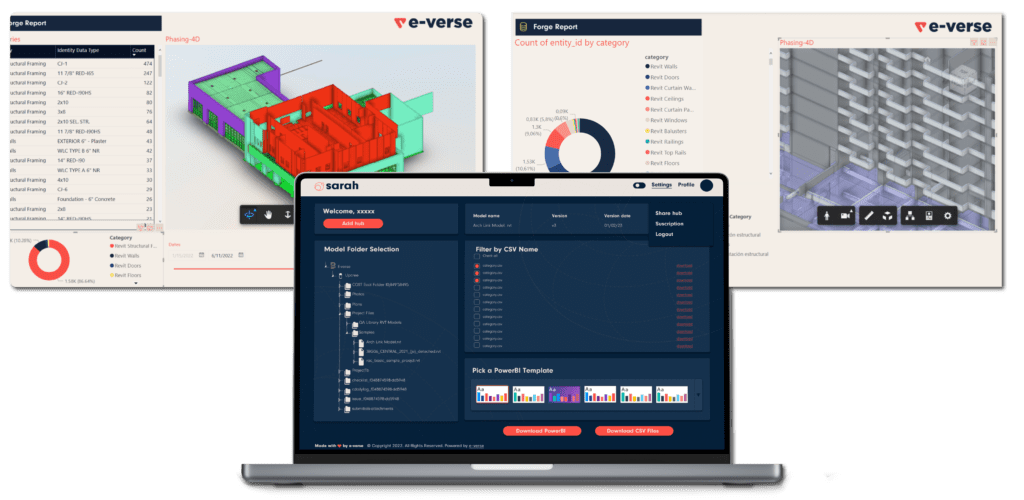
Sarah enhances the visualization process by enabling you to display 3D information on Power BI. This functionality allows for a deeper understanding of your data, particularly when looking at spatial relationships within your Autodesk Construction Cloud models. We included all this in the template you can download from the app. More templates are coming soon, too!
Using Filters and Tools in Power BI
Data visualization isn’t just about creating visuals; it’s also about making those visuals meaningful and actionable. Power BI offers various tools and filters to help users customize their visualizations, highlight specific data, and derive precise insights.
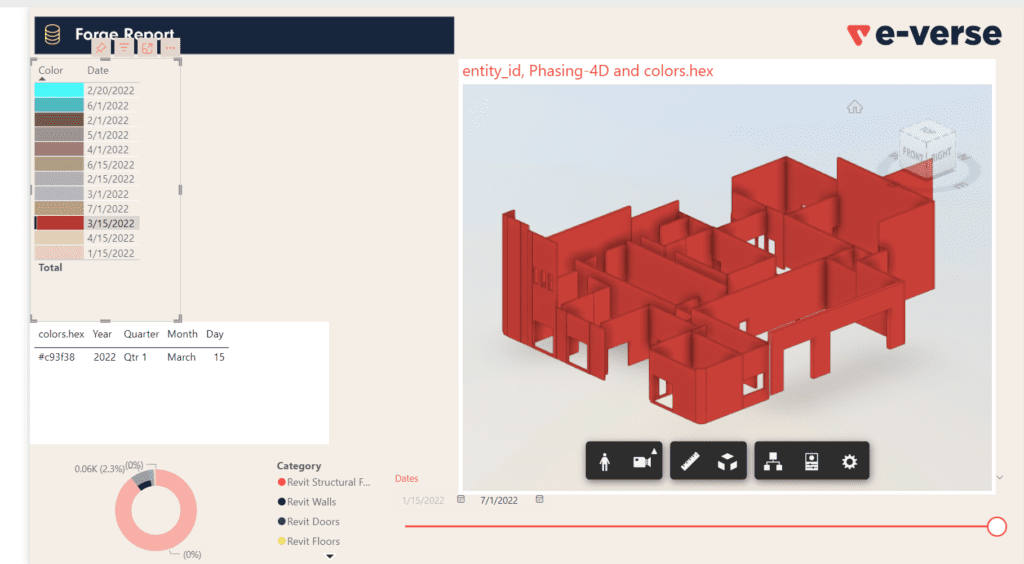
Sarah complements these functionalities by allowing you to filter data by date, turning your reports into 4D tools. This feature provides a timeline of changes in your data, adding an extra layer of insights that can significantly impact your decision-making process:
Fine-tuning Your BIM data Visualizations
Once you have your basic visualizations set up, you can start fine-tuning them. Power BI provides various tools to customize your charts and graphs, including options to change colors, add labels, and adjust scales. Get creative and make your visualizations truly your own.
Sarah also provides functionality that allows you to isolate elements to see specific project data in real-time, further enhancing the level of detail and insight your visualizations can produce, particularly beneficial when you need to drill down into your data and focus on specific aspects of your project.
Exporting Your Data Visualizations
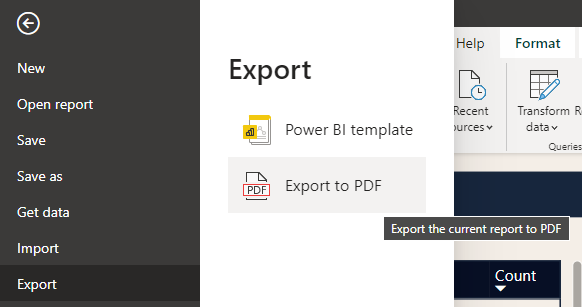
Finally, when you’re satisfied with your visualizations, you can export them for presentations or reports. Power BI offers PDF exports under Home>Export, allowing you to share your insights in a format that suits your needs.
You can also create templates based on reports you made and continue improving your data visualization processes, and even share your reports online with Power BI’s web version. An important note is that you can use the data exported in CSV in any other software outside Power BI since it’s a standard format compatible with most programs like Google Sheets, Excel, Tableau, Looker Studio, and others. So, go crazy with it.
Conclusion
BIM Data plays a crucial role in the design and construction industry, and tools like Power BI and Sarah can significantly enhance this process. By understanding your Autodesk Construction Cloud data, effectively setting up and using Power BI, and leveraging the capabilities of Sarah, you can turn your complex data into meaningful, actionable insights. After all, BIM without data isn’t BIM!
While the focus of this guide has been on translating Autodesk Construction Cloud data to Power BI using Sarah as a bridge, you can apply the principles and techniques discussed here to a range of data visualization tools and platforms. The key is understanding your data, choosing the right tools, and using them effectively.
This guide is a starting point, but data visualization is a vast and evolving field. Feel free to experiment, explore new tools and techniques, and continually learn and adapt.
As you continue your construction data analytics journey, remember that Sarah is there to assist you in analyzing and visualizing data with Power BI. Happy visualizing!

Francisco Maranchello
A proactive entrepreneur at heart who constantly seeks new challenges. As an Architect who codes, I have broadened my skill set through a passion for technology and innovation. I believe technology is the future of architecture and the built world. Always learning and leveraging cutting-edge technologies to seek new answers, I bring a holistic approach when facing new challenges.