01
Data Processing Services for BIM Projects
In other industries, the interoperability construct has evolved beyond the purely technological domain to encompass multiple dimensions. Within the construction industry, these dimensions of interoperability have yet to take root.
The good news is that the necessary technology to improve this is available, and at e-verse, we are here to help with it by turning this data from interoperability into actionable information. ****
At e-verse, we focus on improving how people interact with the built world, so we work on finding ways to visualize construction data and make better decisions within the AEC industry.
There are many ways we can describe this workflow, but we prefer the following:
- Data Engineering: before analyzing the data, it is first essential to make the data source available. We have found that this step sometimes is the most prominent wall that prevents us from moving forward.
- Data Analytics: moving forward to this step means we have come a long way, including data cleansing and data conversion. In this stage, we set the data to work for us.
- Data modeling and prediction: here, everything is related to finding the underlying mechanism through which our system generates data. If we understand how this works, we can predict or infer possible future outcomes and prepare for them.
Imagine visualizing the status of your construction projects in a single place, always up-to-date with data collected automatically in real time from your design team (or even the site).
Additionally, with our data processing services you’ll be able to display all the statistics from your BIM model, and derive conclusions across a single project or multiple ones.
That’s the world where we want to live! And it’s possible. We can work together to achieve it, one iteration at a time.
02
BIM Data Management: The e-verse way
We have worked on construction data management issues in the AEC industry from different stakeholders’ standpoints. These challenges have allowed us to know the way around this world of complexities.
We can create cloud-based reporting architectures, where data flows automatically like a river, not depending on any particular server or machine. We also can export and import data programmatically from different sources and to many destinations, creating live dashboards, using machine learning and custom algorithms to leverage BIM data, and many others.
Turn your BIM data
into actionable information.
02
Data Processing Services Key Benefits
- Improves overall performance through custom-tailored solutions for your organization.
- Combines automatically data from various systems.
- Enhances transparency for project owners.
- Generates reliable and insightful metrics from across all project portfolios.
- Expands efficiency, insights, and effectiveness in the entire workflow.
- Avoids repetitive and paper-based reporting.
- Integrates multiple and unorganized data systems with poor connectivity.
03
APIs for Data Processing
BigQuery
Fivetran
Hadoop
Redshift
S3
Firebase


06
Case Study
Rewyre Platform
07
Stats
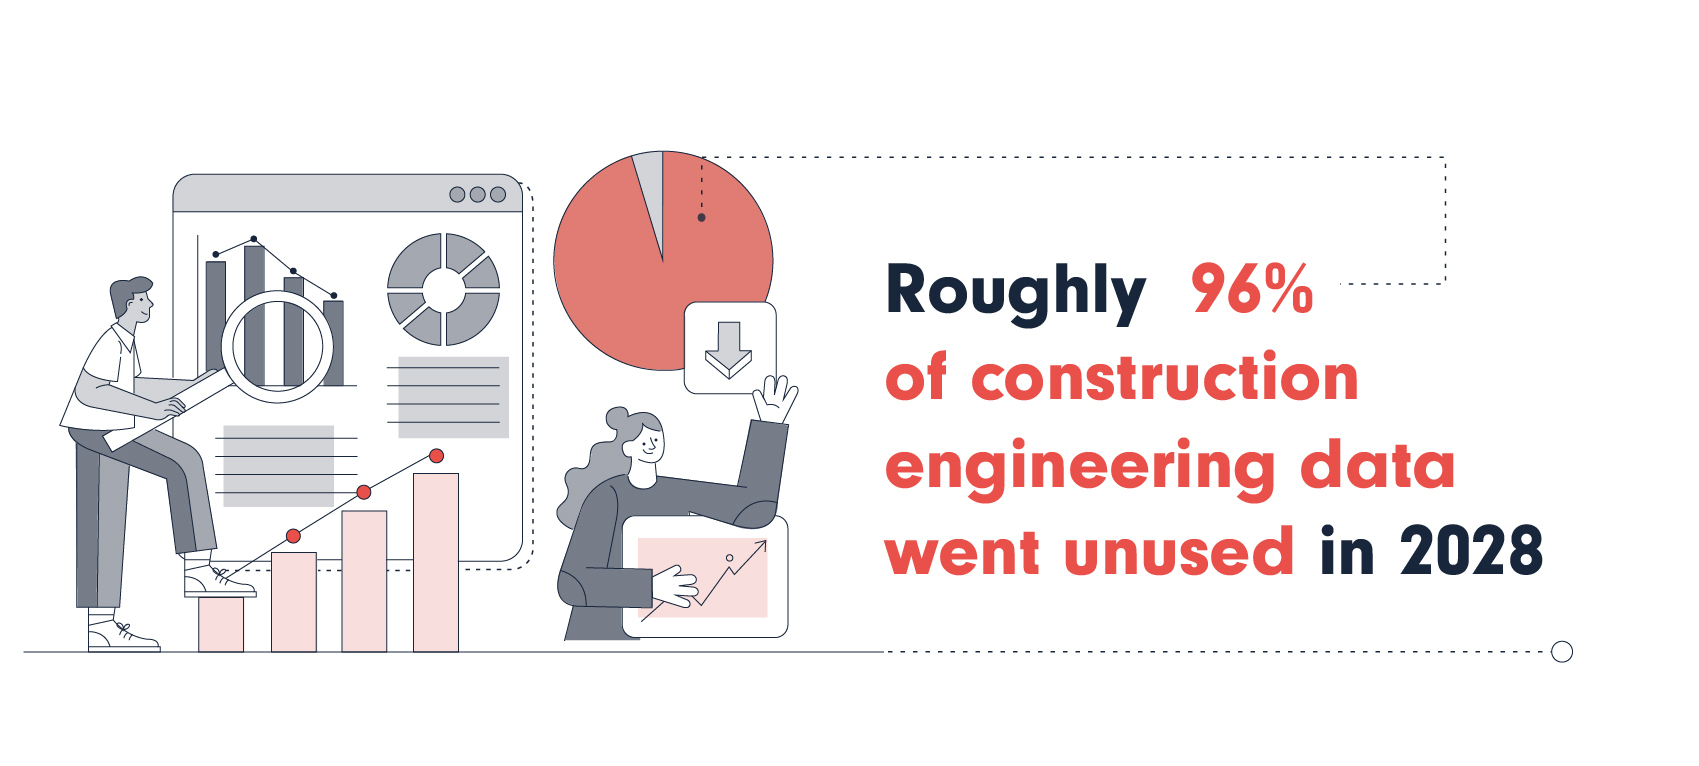
Source – FMI
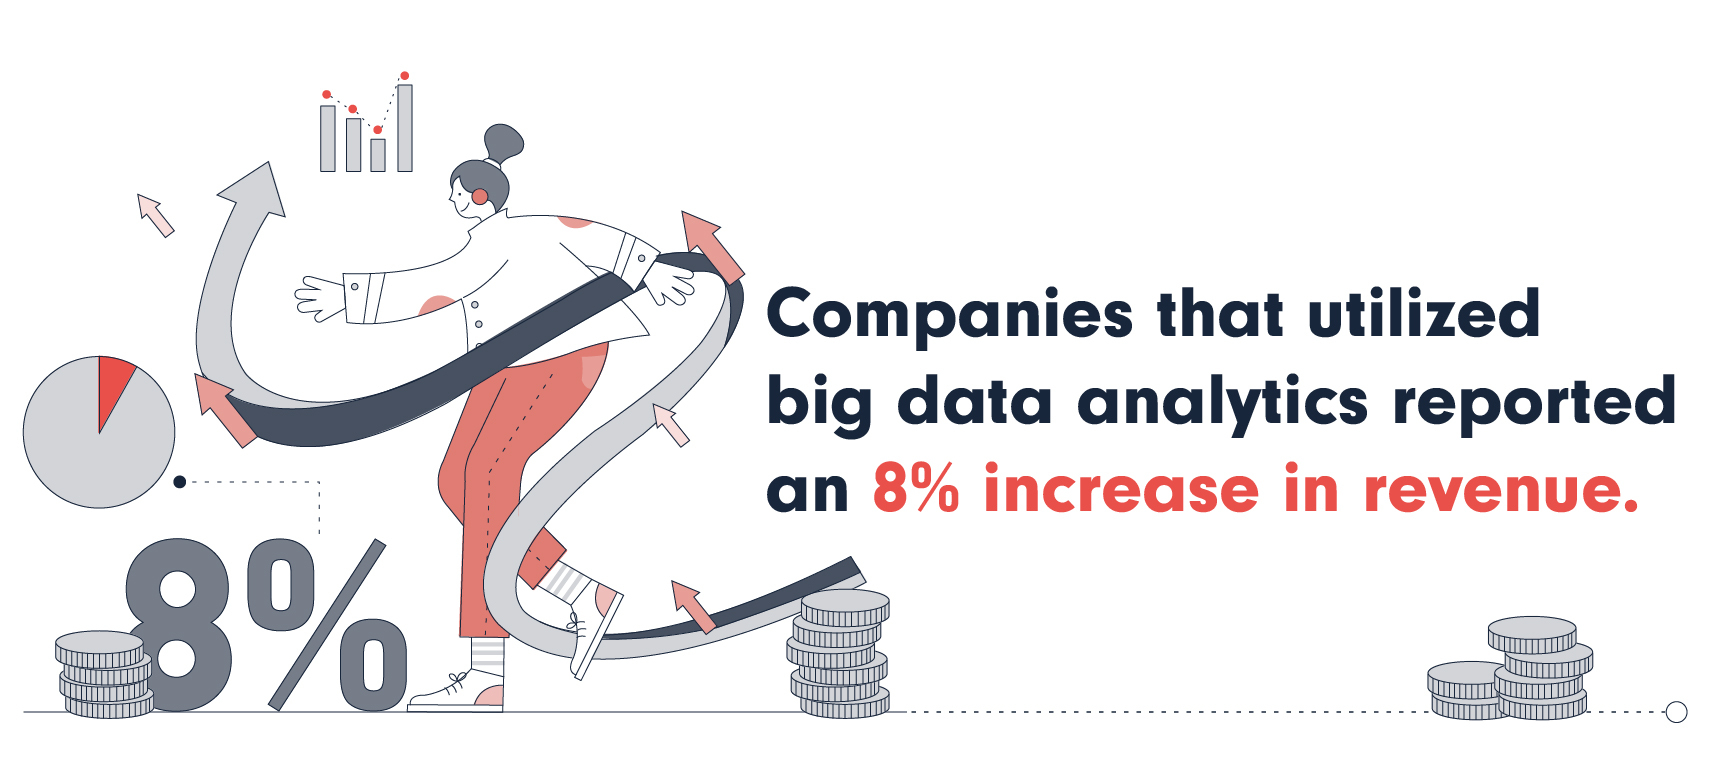
Source – BARC