Implementing AI on a Centralized Data Warehouse Across the Building Lifecycle

A case study
In this post the main goal is to present a case study on how we implemented Artificial Intelligence on a data warehouse across the whole lifecycle of buildings for an owner that wanted not only to improve the building process but also improve their own operations.
This might enlighten other professionals on the ups and downs of what it takes before deciding to implement AI capabilities and the best practices on how to put together a Data Warehouse.
Building Operations and Maintenance
Let’s start by discussing building operations and maintenance, not the most typical process we all work on, but the final stage of a building and where most money is invested in the whole lifecycle. When speaking about operations, we cannot avoid speaking about digital twins, as it is hard to make an efficient transition from the design and construction process to maintenance without the creation of a digital twin.
A Common misconception
Something that It’s seen often is that a Digital Twin is any 3D representation of a building, even sometimes a BIM model is called a digital twin, but that is far from the truth.

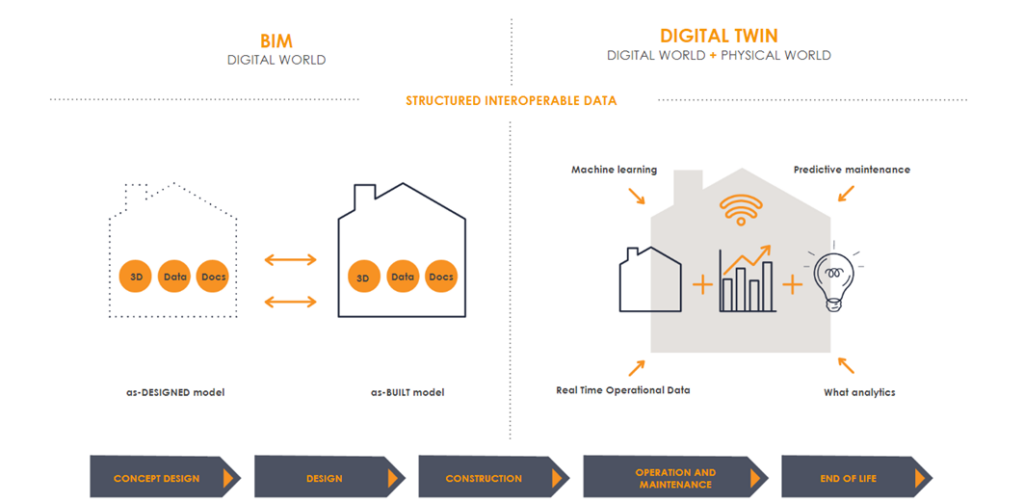
Insight: Defining a Digital Twin
To clarify, a digital twin is not the same as a BIM model. They may share some data, but they are not exactly the same. A BIM model has all the information to build a construction project and should end up with as-built conditions. A digital twin, on the other hand, integrates physical world information like current usage of the building, sensor data, real-time operational data, etc.
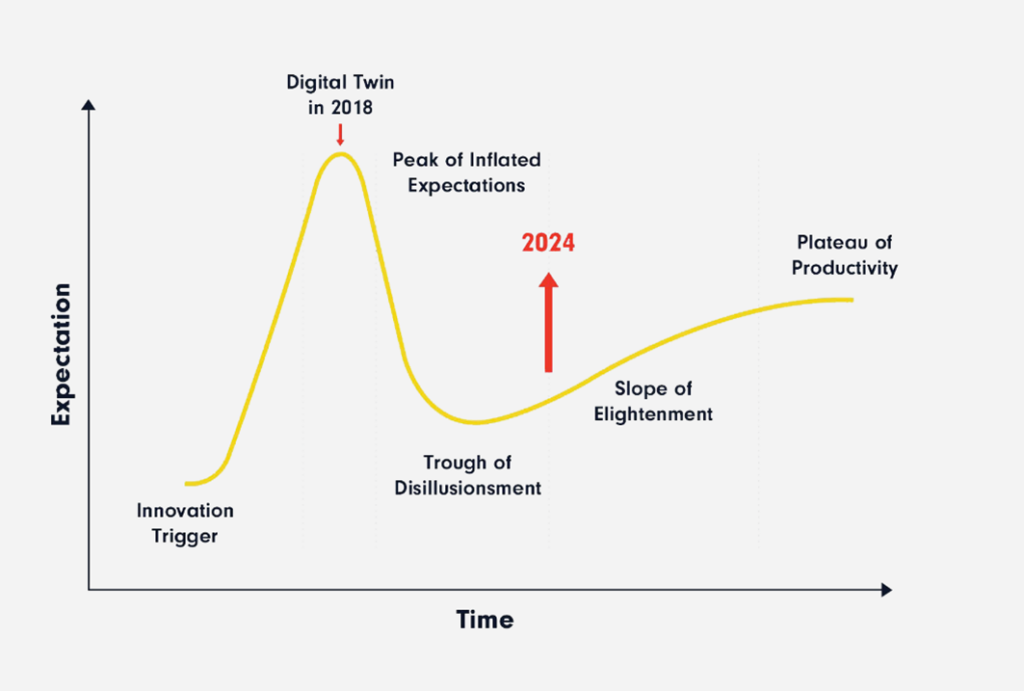
The Hype Around Digital Twins
There is a huge hype around digital twins, as the Gartner hype cycle(a graphical representation of the maturity, adoption, and social application of specific technologies) shows. In 2018, the peak of expectation was reached for digital twins, but today we are still trying to make it a solution that is widely used and standardized. Google Analytics also shows a growth and steady interest in digital twins over time.
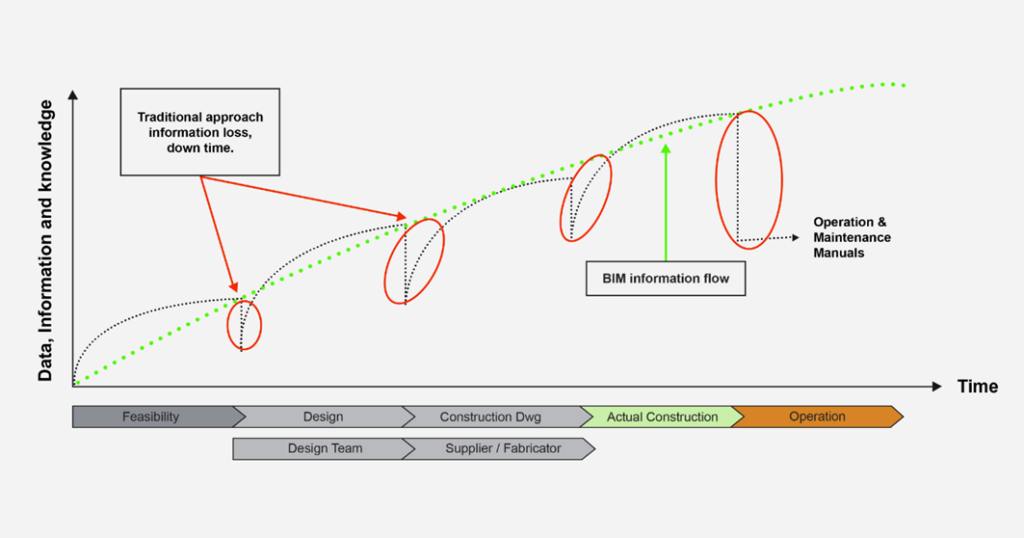
The Ideal Scenario
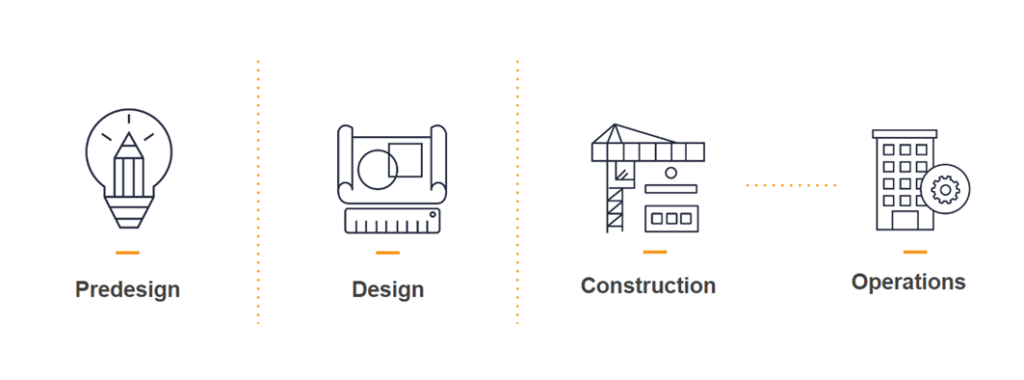
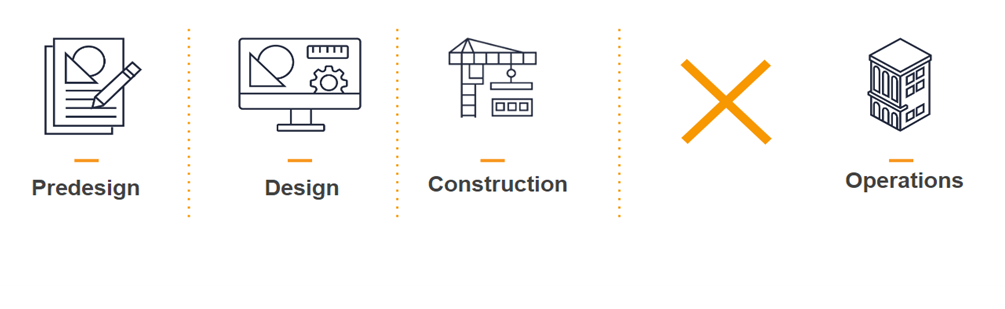
The ideal scenario would be that data is carried over from pre-design, design phases, and construction, and after construction is done, it is handed over to the operations team and then lead to the creation of a complete digital twin.
A Personal Experience
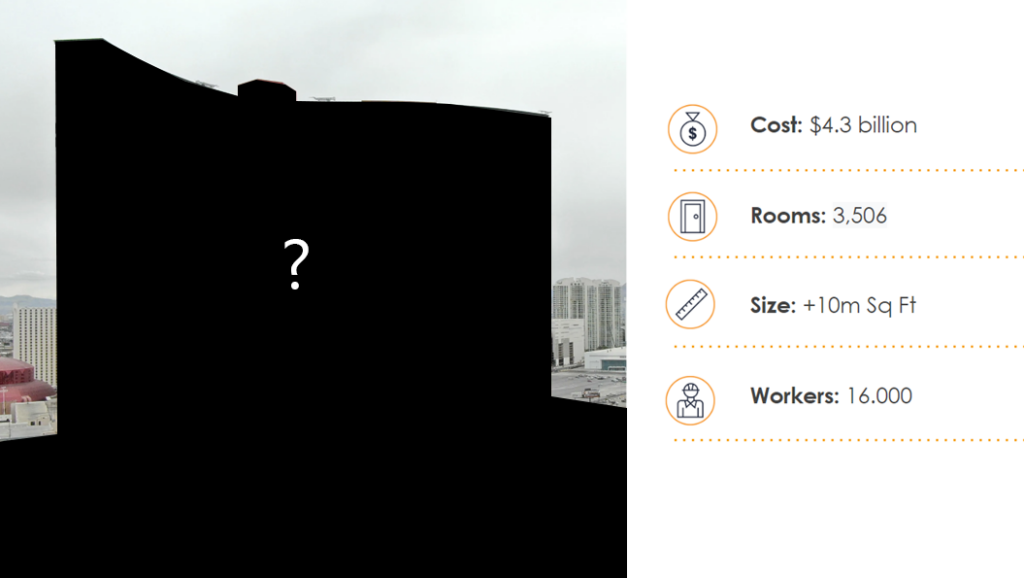
I worked on project in Las Vegas, where we tried to implement this ideal scenario. This was a huge project with a cost of $4.3 billion, 3,506 rooms, more than 10 million square feet, and 16,000 workers. I was working with the owner and was in charge of creating all the as-builts, standards, drawings, and models for this casino. I was excited about the opportunity to coordinate such a big project and put together a bulletproof strategy to hand over all the necessary documentation so it could be used in the operations phase. In my mind, I could imagine a glorious digital twin being used after we were done.
The Reality
However, everything changed when a director of operations and maintenance was hired, which is a mistake most owners make – hiring a maintenance manager when construction is almost done. What was supposed to be a great handover never happened. He said that the asset management tool they selected didn’t have a connection with 3D models and that they would not need most data, just some Excel files to use as input for the asset manager.
Lessons Learned
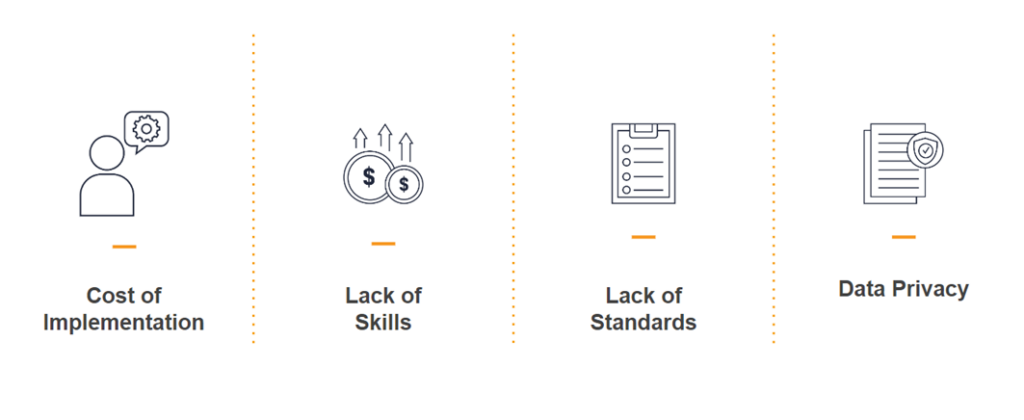
This process allowed me to learn that due to multiple factors, such as the cost of implementation to integrate an asset manager with 3D models, owners don’t want to pay for it. Maintenance people don’t see the value because they lack the skills to manage a 3D model. There is a lack of standards on how to create a digital twin and integrate it with an asset manager, and there are also a lot of concerns about how to deal with data privacy.
The Current State of Digital Twins
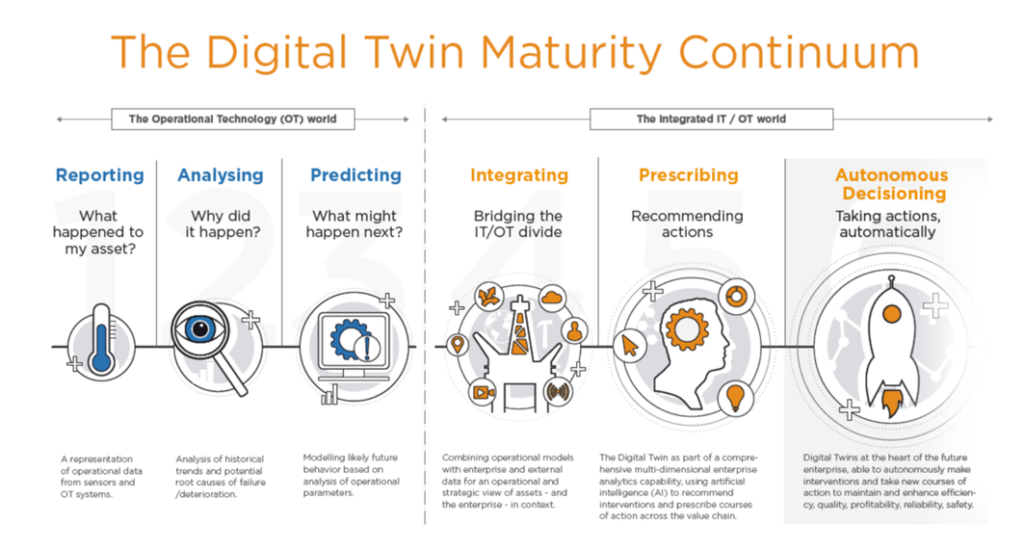
I understood that the digital twin process is not mature enough. Currently, data is only used for reporting, advanced analytics, and even in some asset managers to predict what might happen, but in most cases, it is never integrated seamlessly with IoT data, prescribing recommendations, or even autonomous decision-making. There is also a big gap between big asset managers that have been used for decades by large corporations and newer, more modern systems that can handle 3D models but are not as robust.
The Need for Data Integration
This is a huge problem that we need to solve. So much data is lost, and potential improvements are missed when all data is not integrated, not only for the sake of a current project but also to be able to use it in future projects and improve the way the construction business works. In every company, we speak about the building cycle, but that is not a real thing.
A New Opportunity
Luckily, after I finished the project in Vegas, another project appeared, a more modest real estate company that wanted to centralize all its data and connect it to operations. For me, this was the perfect opportunity to implement everything I had learned in the previous project and also improve upon it. This time, I was not going to propose a plan that I thought was the best, but instead, I was going to understand the company’s workflows and integrate without disrupting their way of doing things too much.

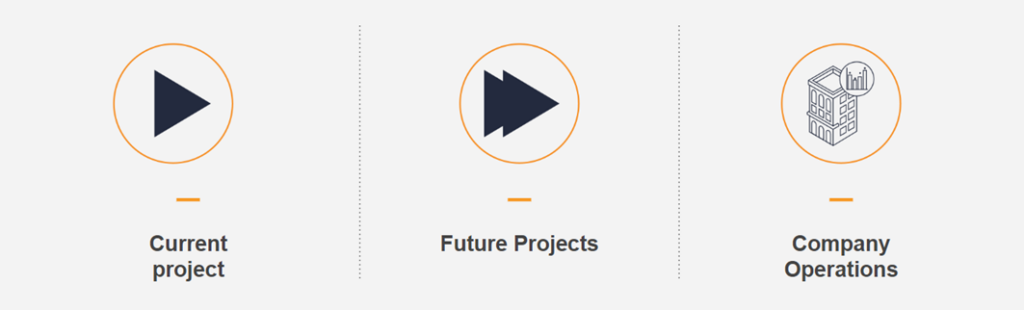
Project Goals
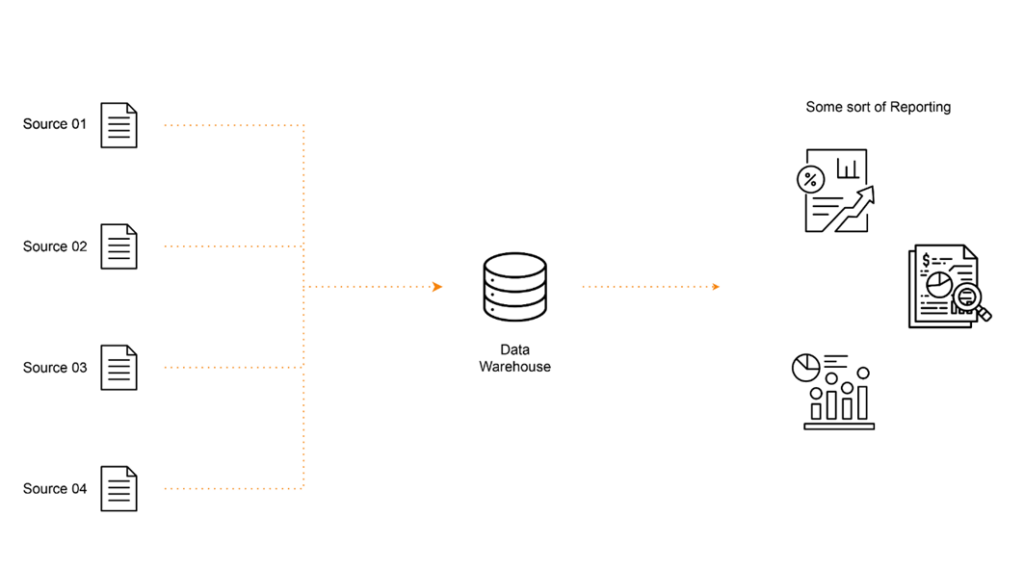
The main goal was to improve any ongoing project, decide how to improve future projects, and also improve the company’s operations. The company decided to go with IBM Maximo as its asset manager, so we would keep Maximo and integrate it with software platforms used in construction and platforms used to plan future developments. The idea was to create a centralized data warehouse integrating multiple sources and then show outputs by creating reports.
Output Strategy
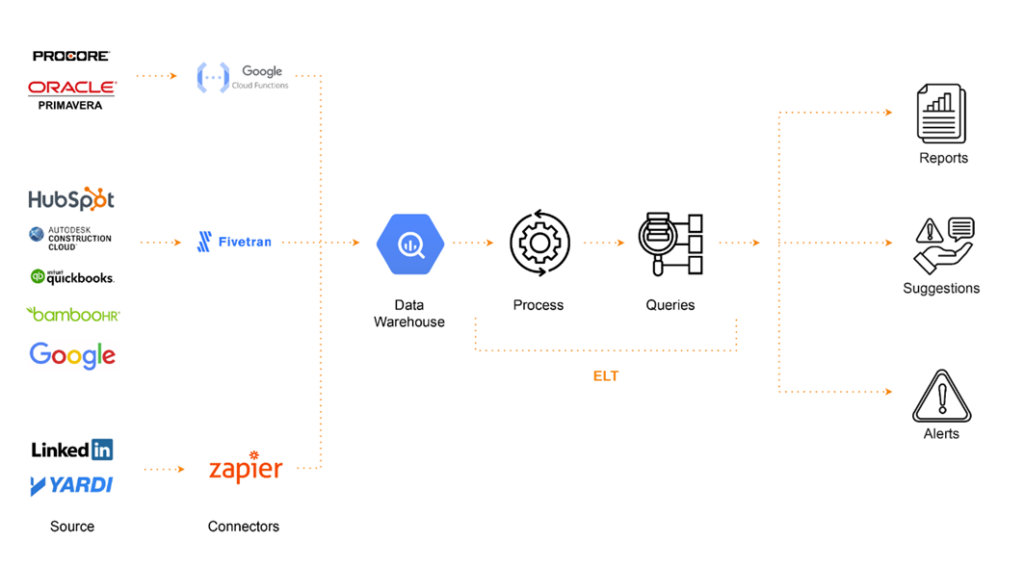
We then decided that we were going to do with the output, so we separated it into three different components: first, create reports; second, create an API to interact with for suggestions on how to make things better or make queries; and finally, create alerts to send notifications to the users. We also created a matrix where we separated each of these actions depending on the stage of time.
Data Gathering Strategy
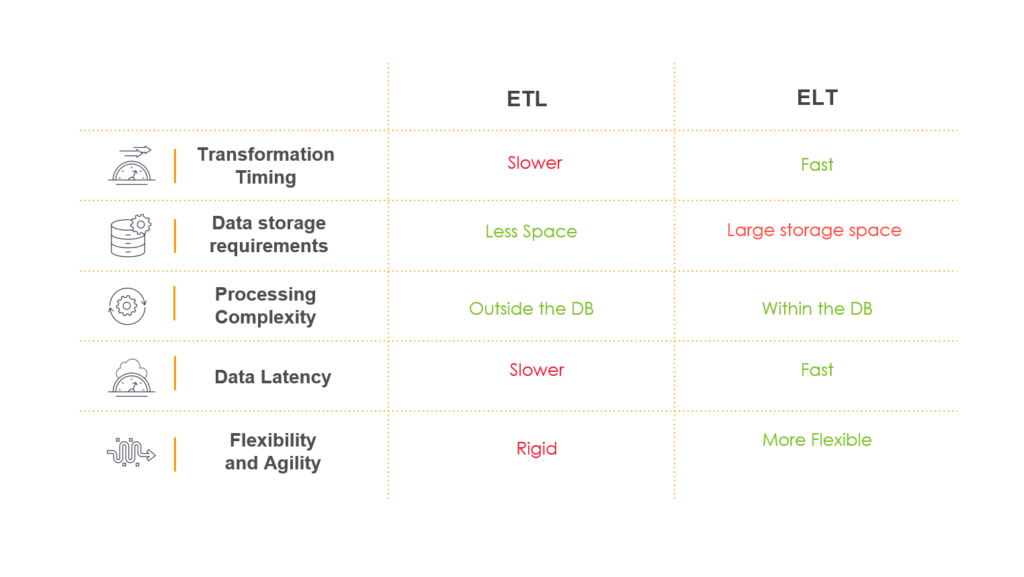
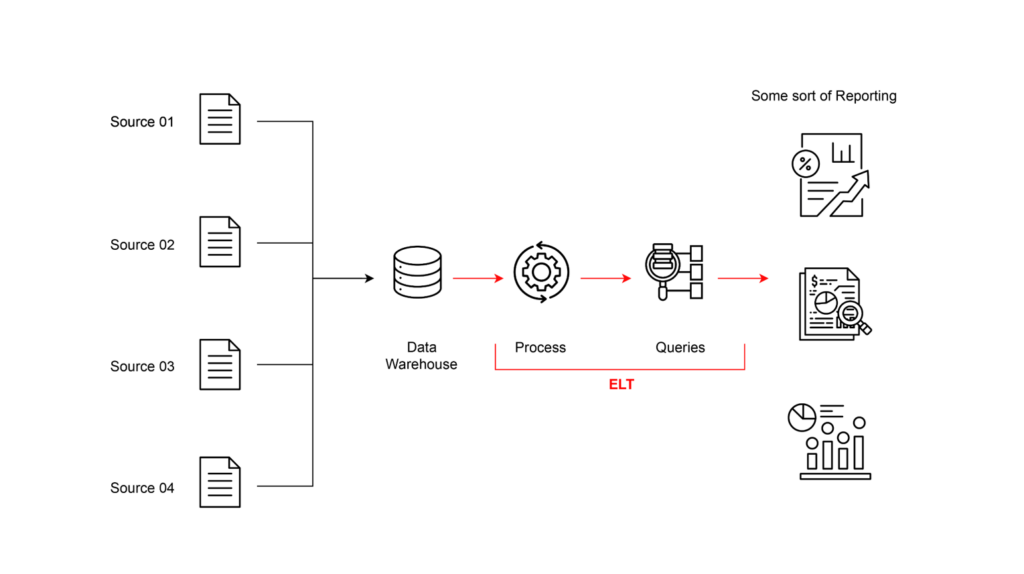
The first question was what strategy to use when gathering data. We had to choose between ETL and ELT. The first one is slower and more rigid, so we decided to go with the second one, which is more flexible and fast. We defined that we would send the data raw to the database and then process it later for a centralized approach.
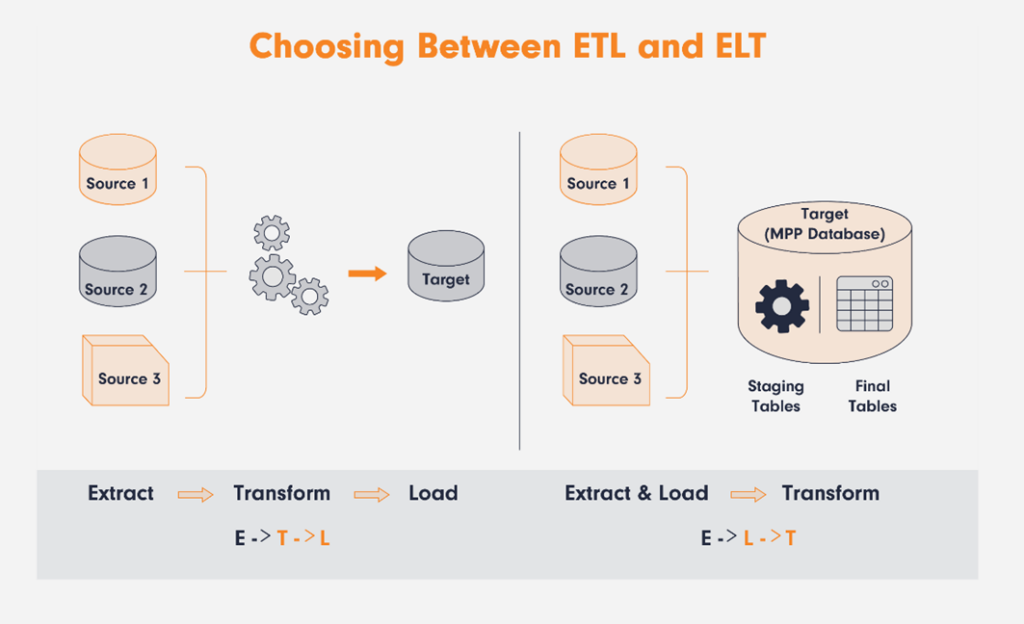
So, as a result we add the steps of process the raw data and based on that generate specific queries that could be use by any of the software services.
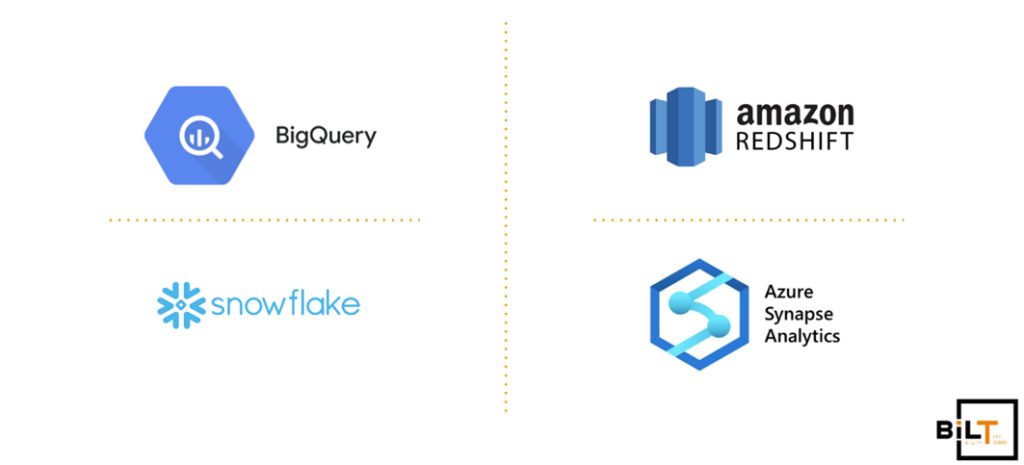
Selecting a Database
We needed to select a database service that was flexible enough to host all the current data and new sources if that happened in the future. Our options were BigQuery, Amazon Redshift, Azure Synapse Analytics, and Snowflake. In the end, we decided to go with BigQuery, as the client was already using Google infrastructure, and it was a great solution for our problem.
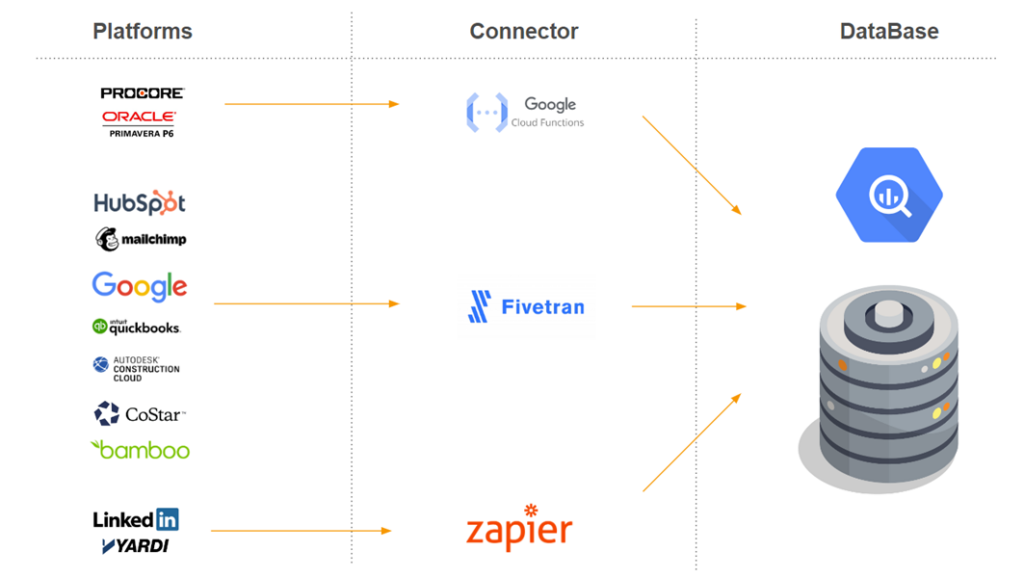
Connecting Data Sources
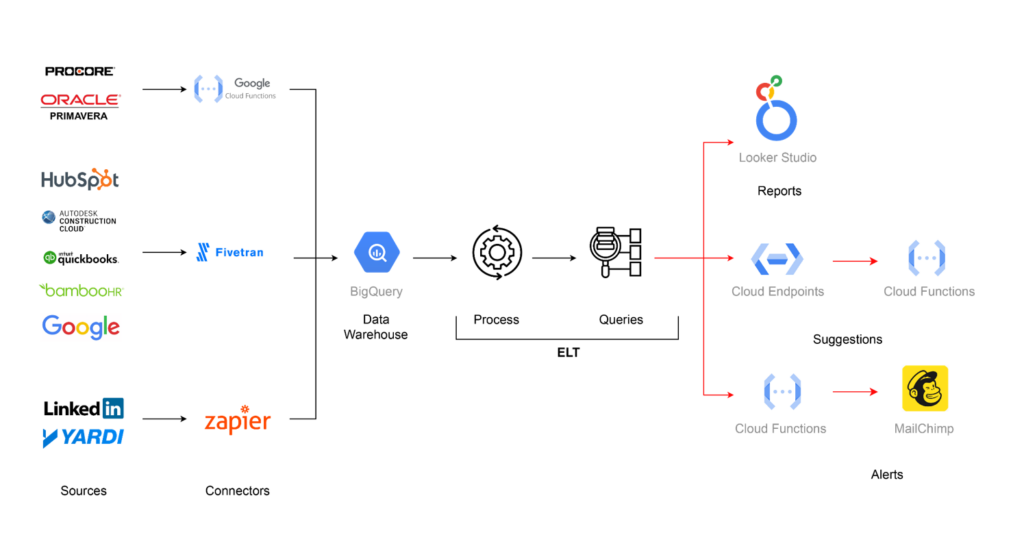
At this point, we had our sources and our database, but we were missing a way to connect them. We prioritized finding off-the-shelf solutions instead of trying to handle it ourselves. This would save us a lot of trouble every time an API changed, for example. We decided to go with Zapier and Fivetran whenever we could and rely on custom serverless functions when those options were not available.
Presenting the Output
Finally, we needed to define how the output was going to be shown to the user. For the reporting portion, we decided to go with Looker to keep all the infrastructure under the Google roof. To create the API, we decided to use Google Functions, which is a serverless option, as we wanted to make most of the architecture serverless. To create alerts, we decided to go with Google Functions as a webhook when something happened and use Mailchimp to send emails and notify users, as this was what the company was already using.
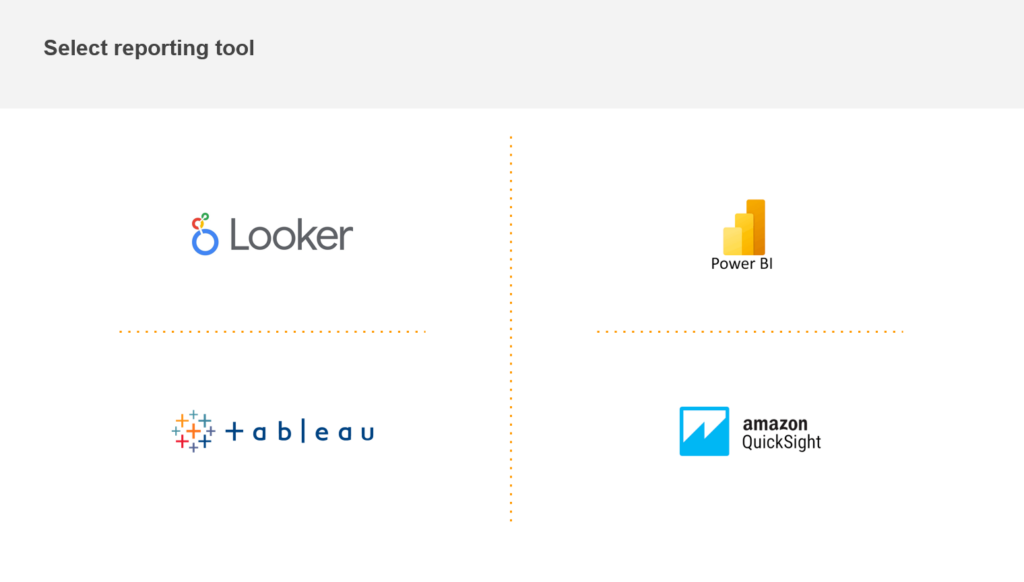
Selecting a Reporting Tool
We needed a tool to report the data from the data warehouse, we where more inclined with Power Bi, but given the fact that most of the infrastructure was already in Google and the customer already had experience using Looker, we decided to selected as the tool for visualization.
Select a tool to create suggestions
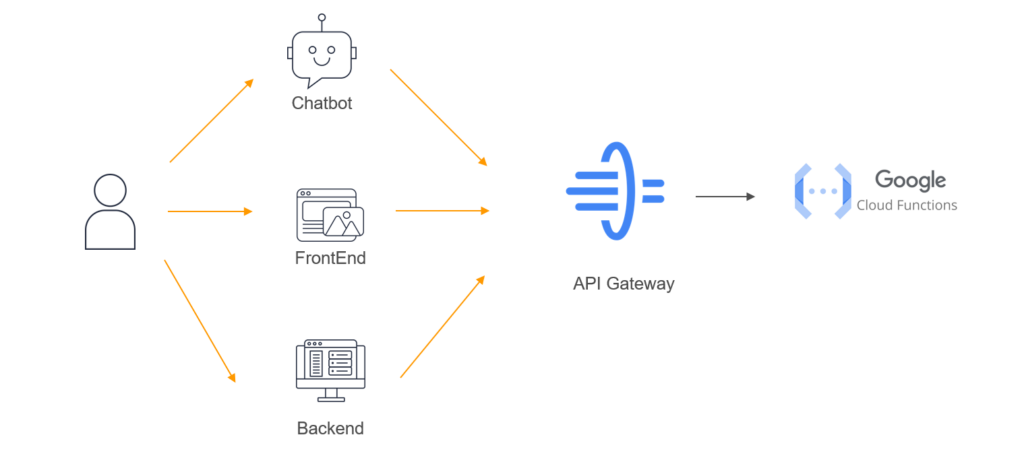
We also needed a way to create an API that we could connect to other tools like Slack, Chatgpt or a custom front end, for that we decided to go with cloud service functions, this are serverless functions that due to the variability in the use and the scale was perfect for us.
How to create Alerts
For the alert module we decided to allow the use to define rules on a Google Spreadsheet, and then through a google function use MailChimp to send email notifications, as this was also a service that the client’s marketing area was already using.
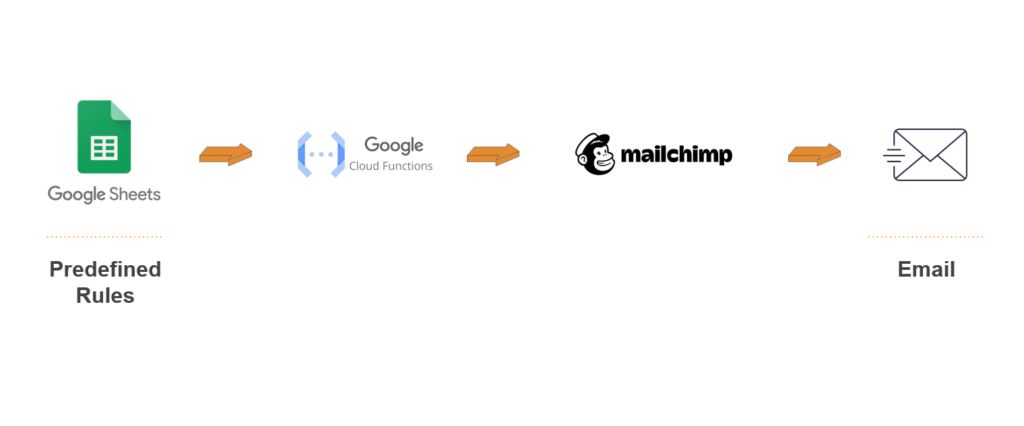
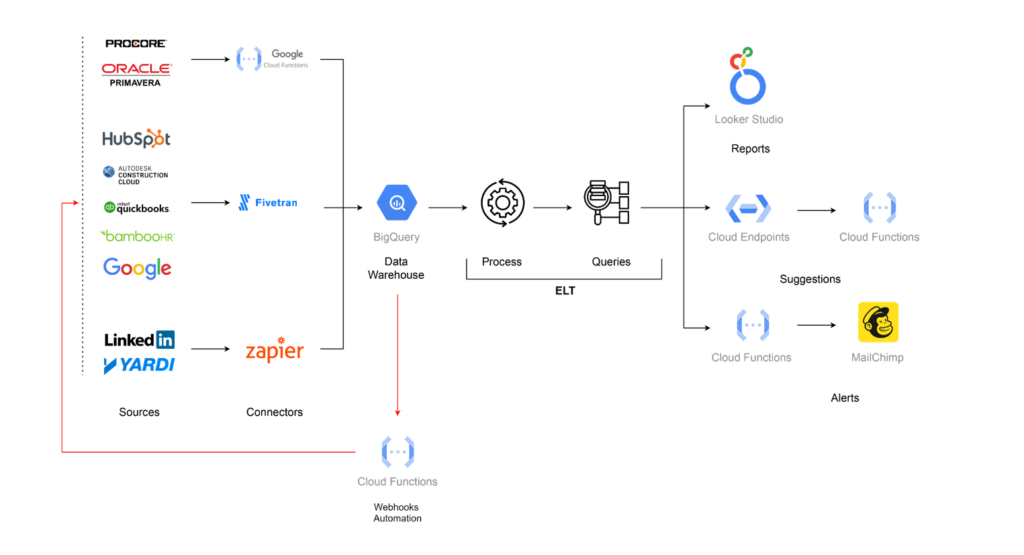
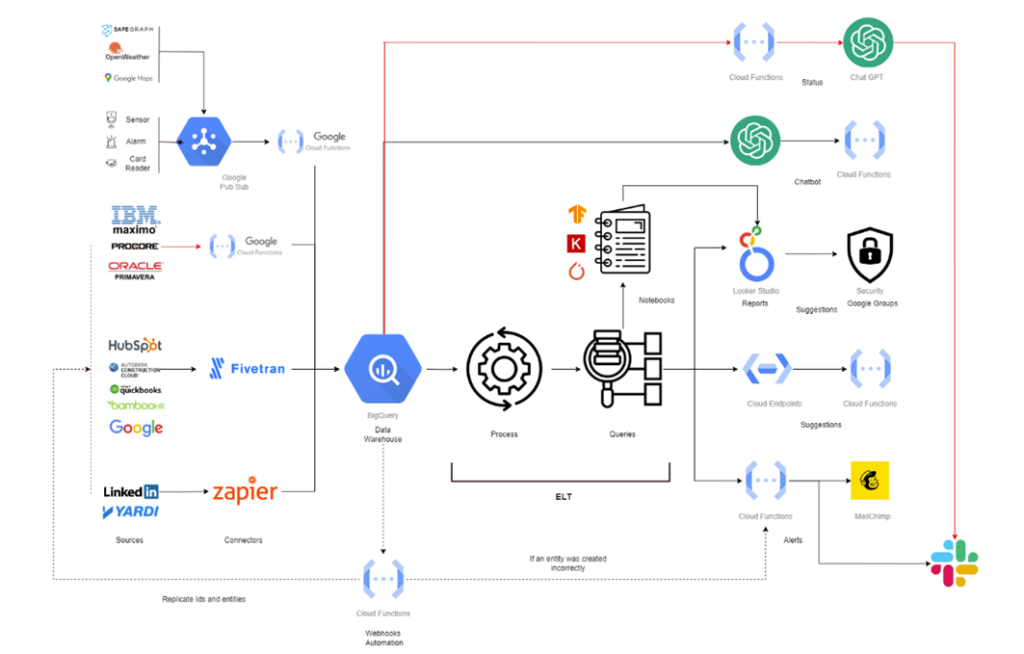
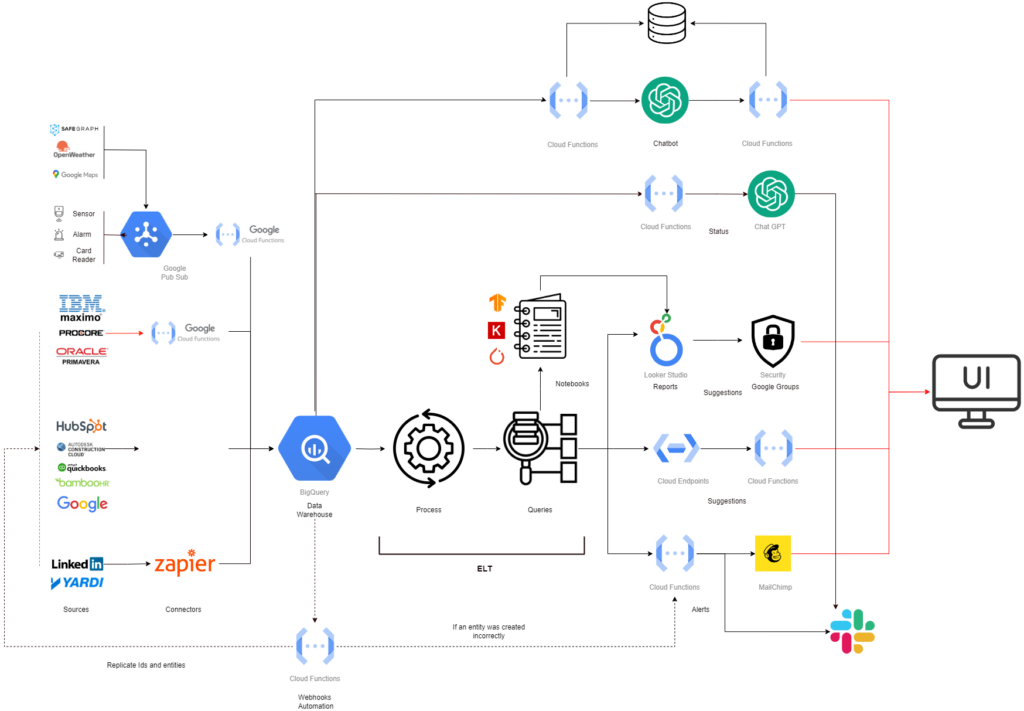
After selecting the different tools this is how the process looked like.
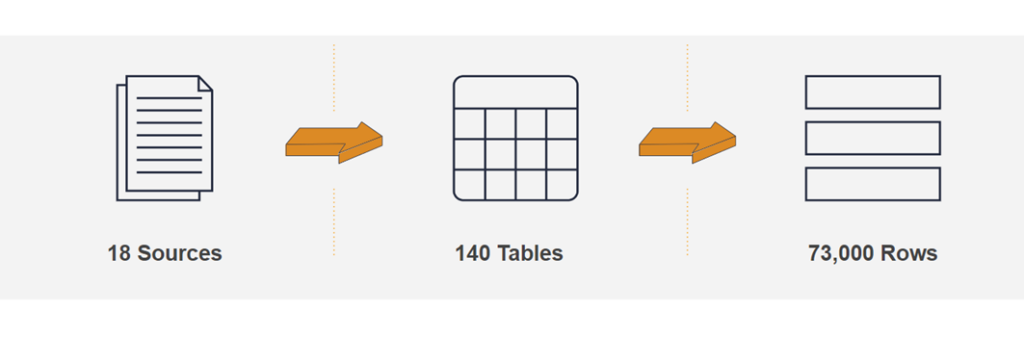
Data Organization
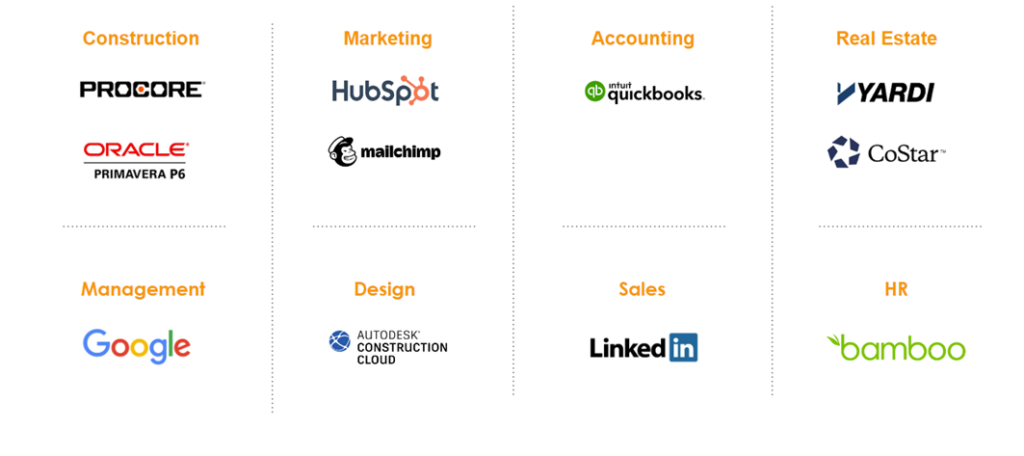
After the selection process, we created one dataset per source, and inside each dataset, we created each API method as a table. Finally, we defined the data schema of each table based on the API responses. After the whole process, we ended up with 18 sources, 140 tables, and 73,000 rows of data.
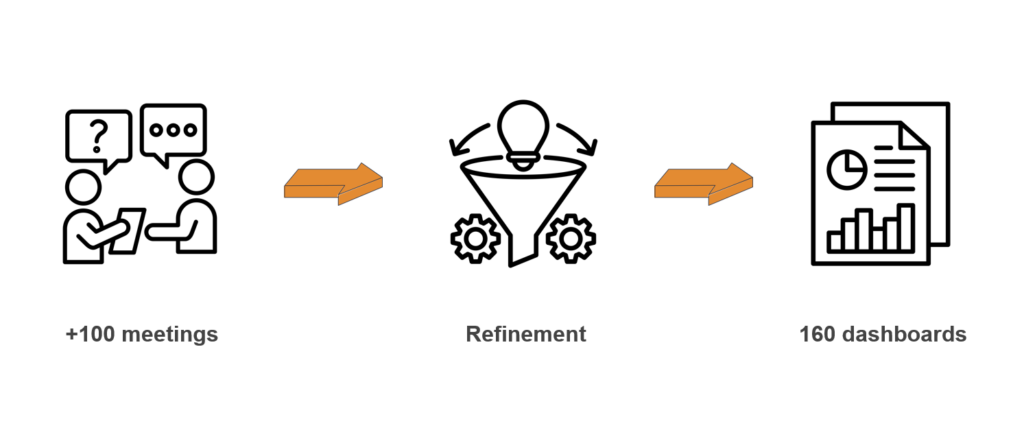
Defining KPIs
When all the data was in place, we needed to decide on a strategy for what to measure and how. We started interviewing each area of the company and defined a baseline of what we wanted to measure. Based on that, we got 80 KPIs they wanted to measure, that where reflected in 160 dashboards.
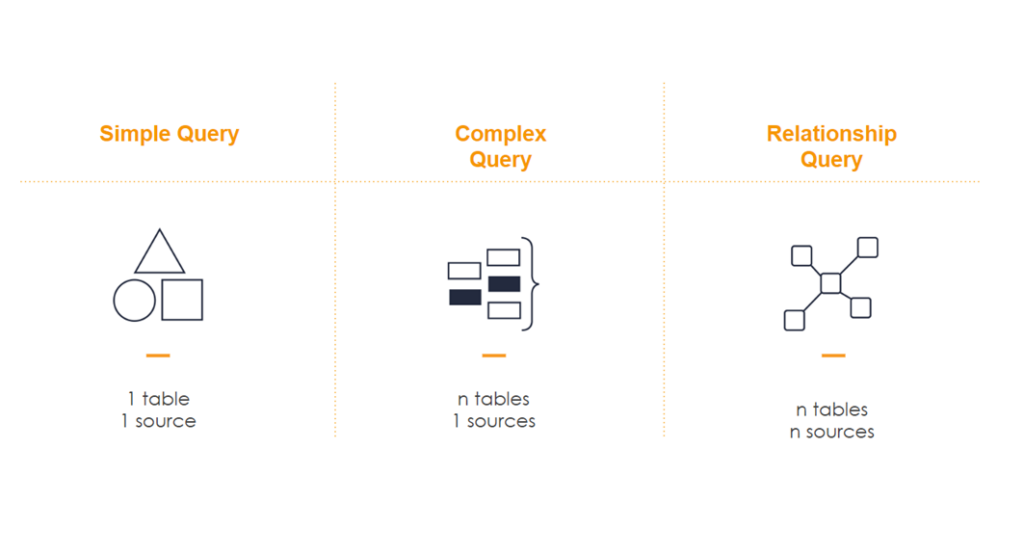
Query Complexity
When we started working on how to obtain these 80 KPIs, we discovered that there were multiple complexity levels of the queries we needed to make. We categorized them into three: a simple query when taking information from a single table that belonged to a single source, a complex query when more than one table but from a single source was used, and a relationship query when more than one table from more than one source was used.
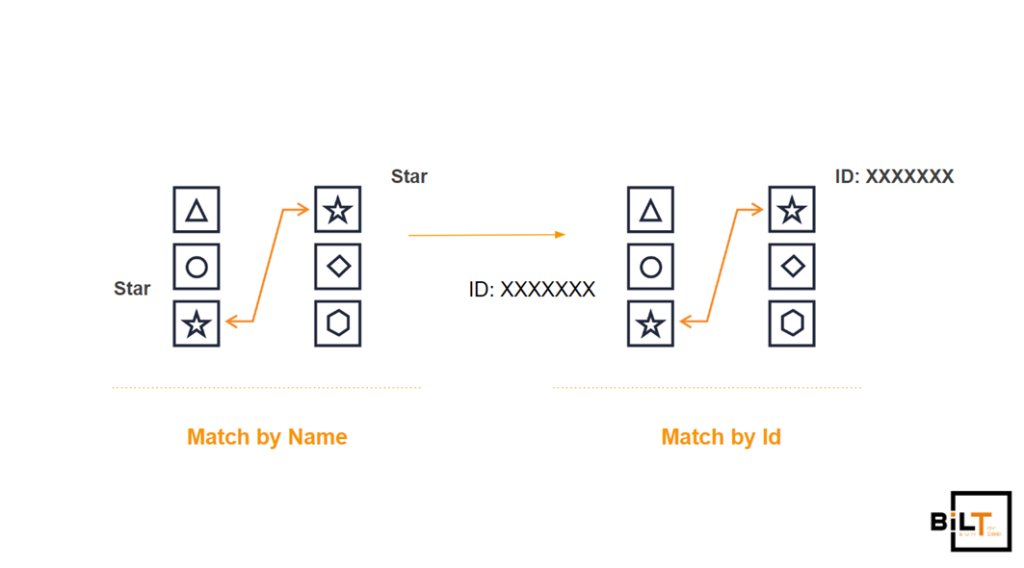
Matching Data Entities
The problem with having multiple sources is that you need a way to match data entities. We decided that each entity would have an ID and that we would use it for matching. To make this work, we needed the user to either manually input IDs from one platform to the other or create webhooks that detected when certain entities were created on what platform and replicated them on the other ones automatically. We chose the latter option.
So the webhooks piece ended up looking like this:
Data Patching
When the process was done, we still ended up patching 20% of the data, which is a lot, but as a first approach, we considered it a win.

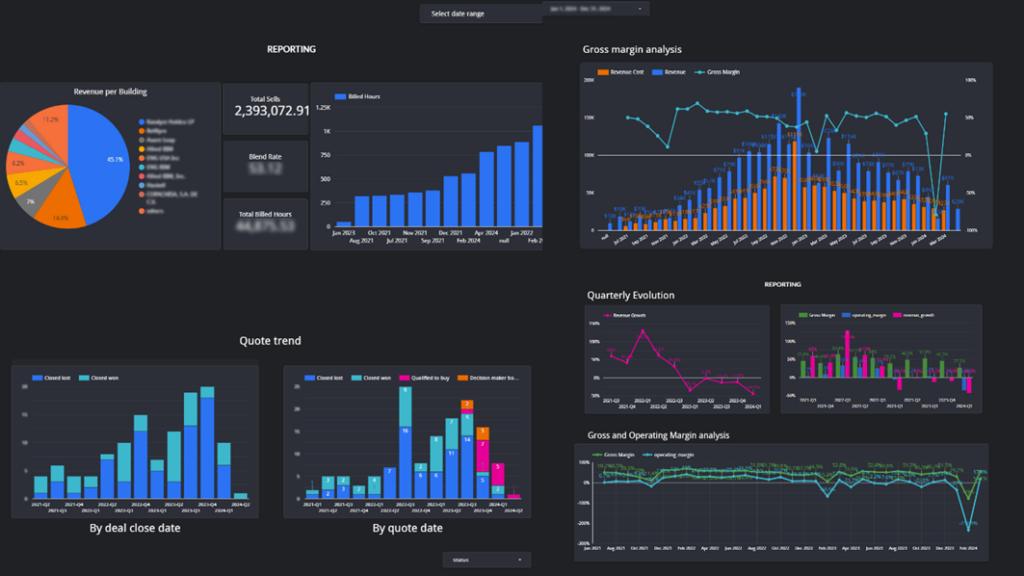
Creating a Dashboard
With all this in mind, we created all the queries we needed and ended up with a version one of a Looker dashboard.
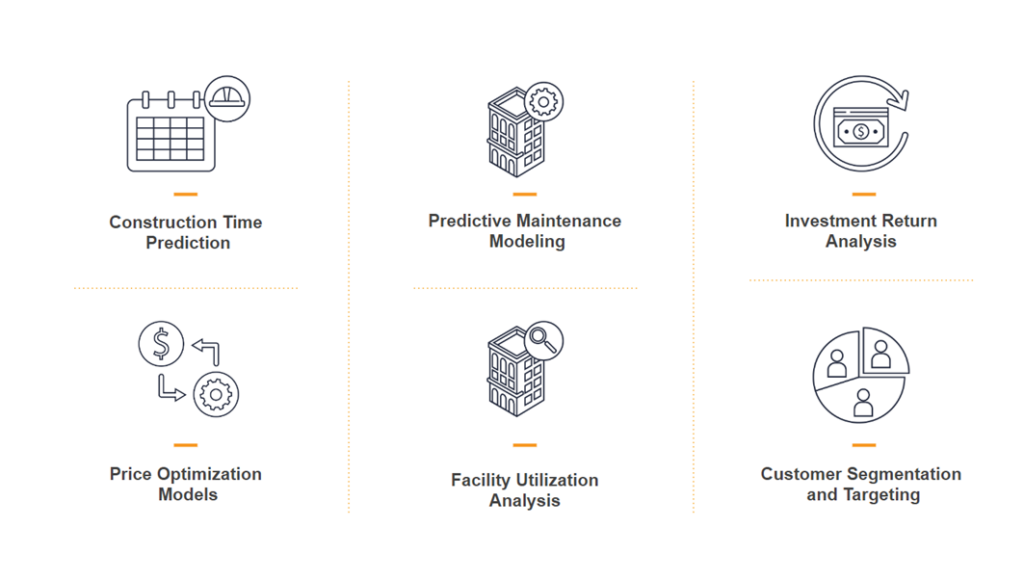
Advanced KPI Calculations
As we worked with our client, they started requiring more complex calculations of KPIs that couldn’t be resolved with simple calculations, such as the predictive analytics of construction time for a project or a price optimization model. For this, we needed to use more sophisticated tools like machine learning predictive models, so we added one more step to the process: Colab notebooks, which allow us to create queries using Python and machine learning libraries like Keras or PyTorch.
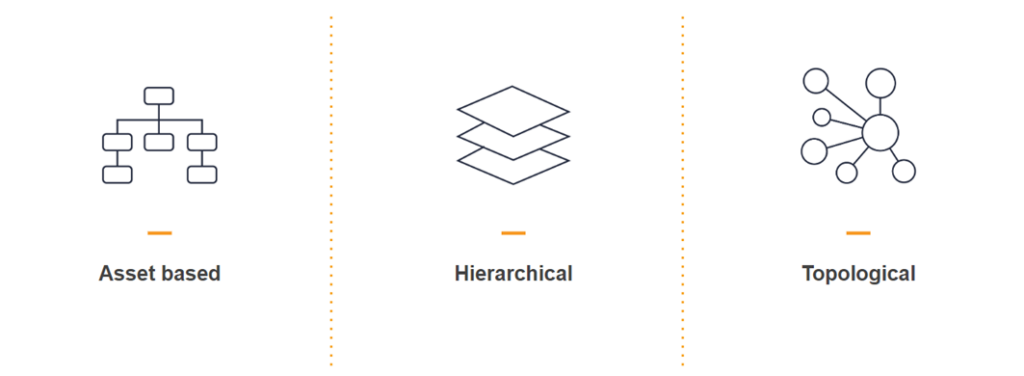
Dealing with Complex Relationships
This all worked great until we started working on improving complex graphs of entities that were related in multiple ways, for example, rooms in a building that can be related by use, location, or even circulation. We decided that we needed to create a relationship that was asset-based, hierarchical, and topological.
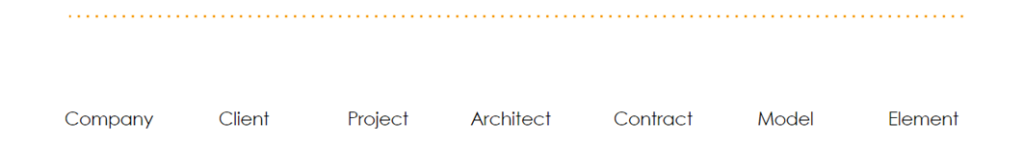
Defining a Schema
We looked on the market for an existing schema but couldn’t find any. On the contrary, most startups we knew had their own schemas. As a baseline, we defined the schema as parent-child relationships, starting with company, then deal, project, building, level, category, and finally getting to an element.
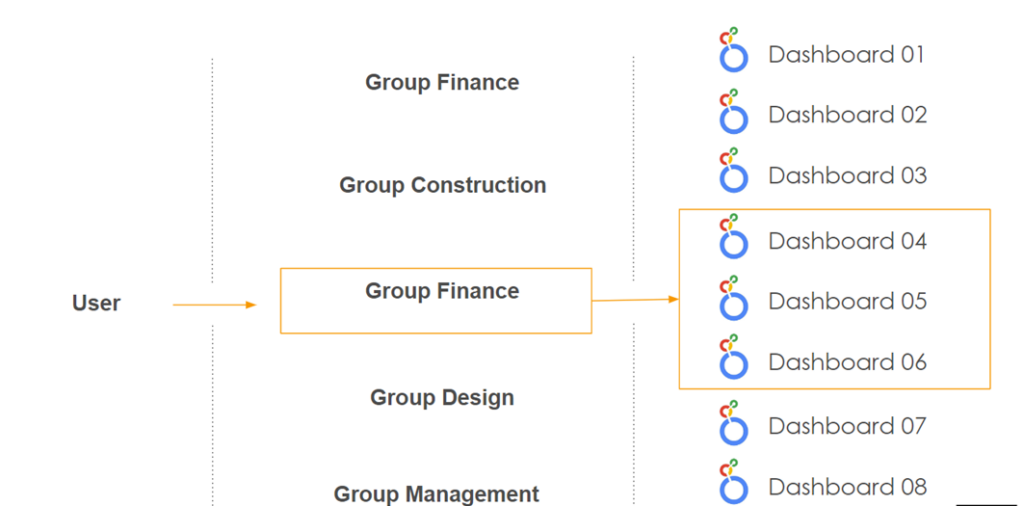
Security Considerations
Another problem we had to solve was security – how we could allow people to see data depending on their position and whether they were internal or external to the company. For this, we came up with a simple solution, which was to use Google Workspace groups as permissions.
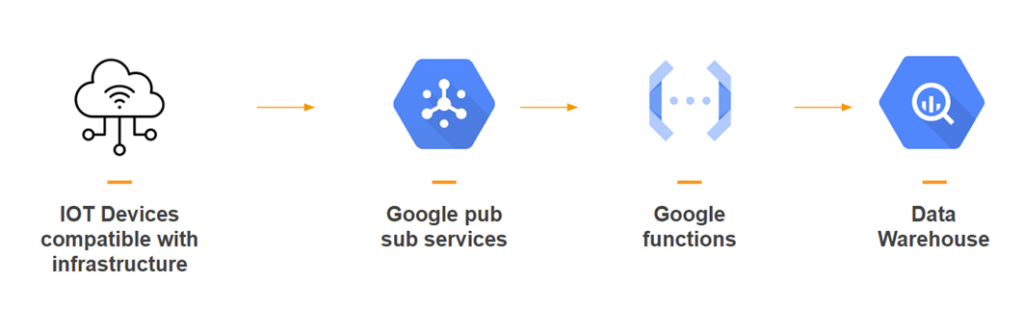
Integrating IoT Data
After all this, we had to add IoT data. For this, we connected IBM Maximo to the data warehouse and decided to connect to each IoT device directly using Google Pub/Sub to have more control over the data.
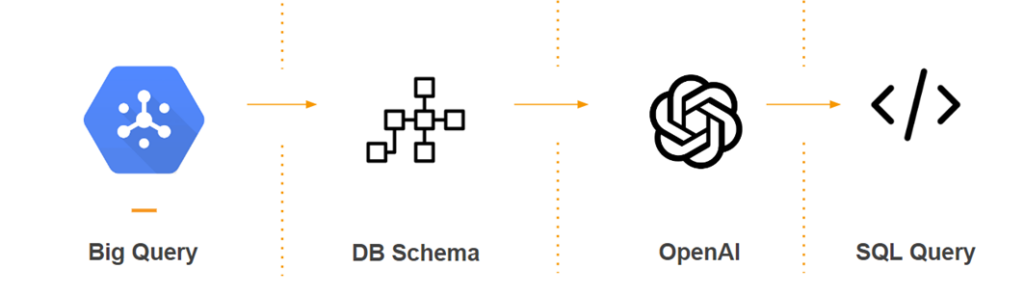
Integrating with an LLM
The final step was to integrate with a large language model (LLM) to provide a chatbot that could provide any data from the data warehouse to the users. The problem was that LLMs don’t have memory, so we couldn’t upload the data warehouse every time someone asked a question, as this was going to be too expensive. We decided that we would only send the schema of all sources and tables, which was really light, tell the LLM to give us an SQL query, and then run that SQL query and display the results to the user.
Generating Weekly Reports
We did something similar to create weekly reports. We would run an SQL query to get the data created in the last week and based on that, create a report that was sent to the user over Slack every week.
Adding a nice looking UI
Finally to improve the experience of the users, we added a UI where the user could access to any of the services in a centralized way.
Lessons Learned
In this project, there were multiple lessons learned. On the positive side, processes improved, standards were generated, data silos were removed, and efficiency improved. On the negative side, data will never be perfect, this comprehensive solution requires a lot of maintenance, there are always too many APIs that change, and you have to adapt. This is also a constant process of adjusting and improving.
Conclusion
Have in mind that centralizing data is currently a must, not an option, if you want to be competitive. Start small with small data connections but always try to go bigger. Finally, make sure you first understand your problem, think of a solution, and then, at the end, implement a tool.