Building Your Own Data Warehouse

A Guide to Empowering Decision-Making
Introduction
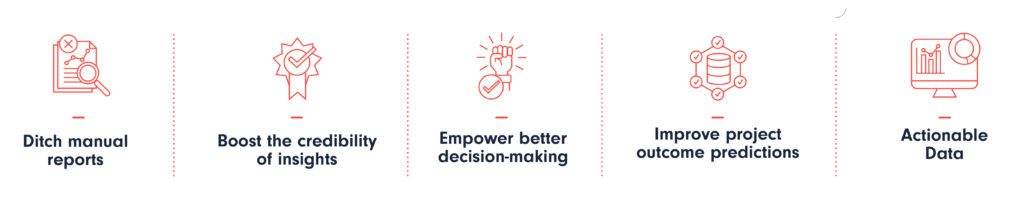
This is the third article in a series about Data Warehouses. First, we broadly described our data ecosystem and then explained how we use it to make decisions. Now, it’s time to dive into how you could build your own. Why? Because it could add several advantages to your business:
- There is no need to build manual reports anymore. Forget about juggling through Excel spreadsheets.
- Increase trust in the insights you’re gathering from company data.
- Better decision-making through more precise live reports.
- Have better insights and predictions on what your future project outcomes could be.
- Have all your data at your disposal to measure whatever you want in the future.
It’s not a simple process, but it sure is rewarding.
Today, we’ll review an example of a data warehouse for a General Contractor (GC) in the AEC Industry, using the data to measure project performance.
The Basics
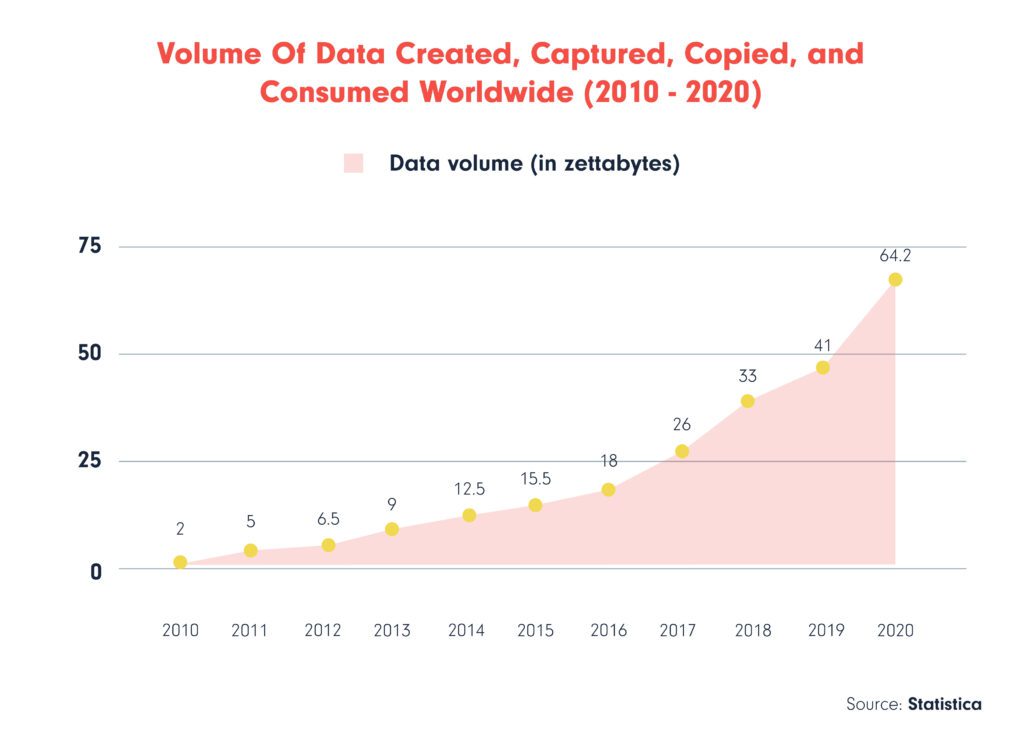
All companies in the AEC are constantly generating data in multiple places. That has been the case since organizations exist. The difference is that most (if not all) of that data is digital nowadays. This represents a massive opportunity since it’s much easier and more viable to centralize and make use of it to gather insights or automate processes than with analogic means.
A Data Warehouse is a place to store your company’s data, regardless of where that data was generated. We won’t go into introductions in this one, so let’s jump right in!
Planning Your Data Warehouse
First, it’s essential to understand three key points:
- What do you want to achieve?
- What data would you need to achieve it?
- Where are you generating that data?
Say you need to measure project performance, from baseline aspects like profit and loss to understanding if you’re meeting your goals at a company level, devising which projects contribute more to your vision. I bet you already imagine the different datasets you’ll need for that. For example:
- Financials (bills, payments received, payments made, etc.)
- Project data (design, materials, cost, budget, planning, etc.)
- Sales data (deals, clients, leads, contacts, companies, etc.)
- Team data (time spent on tasks, payroll costs, team PTOs, etc.)
- Company data (vision, goals, strategic initiatives, OKRs, etc.)
These are just some examples. You should identify all the necessary datasets for your business and understand how to extract them. This process is crucial as the quality and relevancy of your data will directly impact the insights you can derive from your data warehouse.
Data Warehouse Architecture
Your architecture should be designed with scalability and adaptability in mind. As your business grows and evolves, the same will happen to your data needs. Your data warehouse should be capable of accommodating these changes without requiring a complete overhaul.
Based on our example, given the diverse nature of a GC’s data and the requirement for department-specific reports, you might lean towards the Kimball methodology’s bottom-up approach. This design strategy involves creating individual datasets for each department, which can later be integrated for comprehensive, company-wide reporting.
In plain terms, this means you will have data from each department or area in your company available for later integrations and crossovers.
The good thing about this approach is you don’t need to have it all figured out from scratch: you can keep improving on what you have and continue adding connectors and datasets as you go.
Data Modeling and Storage
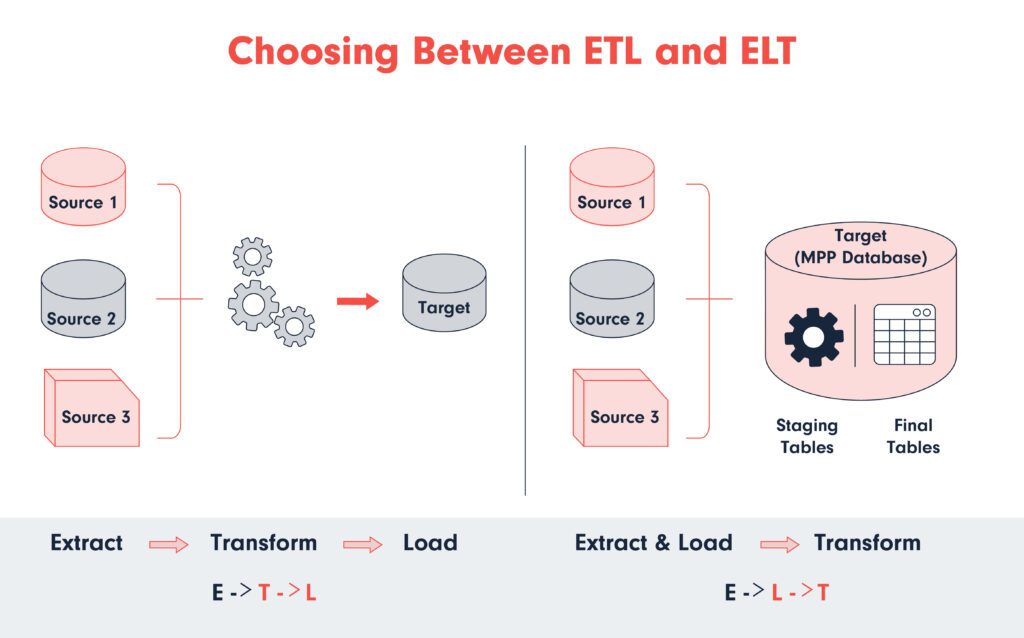
When building your data warehouse, one critical decision is how you’ll process your data for analysis. This typically involves choosing between two main strategies: ETL (Extract, Transform, Load) and ELT (Extract, Load, Transform). Though they may seem similar at first glance, understanding their differences is crucial for selecting the best approach for your needs.
ETL (Extract, Transform, Load)
ETL is a traditional method where data is extracted from various sources, transformed into a standardized format, and then loaded into a data warehouse. This process occurs in a specific order:
- Extract: Data is collected from different sources, including databases, CRM systems, etc.
- Transform: The extracted data is cleaned, aggregated, and reformatted to ensure consistency. This step is crucial for ensuring the data’s quality and usability. It occurs in a staging area, separate from the source systems and the data warehouse.
- Load: Once the data is transformed into the desired format, it’s loaded into the data warehouse for storage and analysis.
ETL is often favored when data quality and consistency are crucial, as the transformation step occurs before loading, allowing for thorough data cleansing and validation.
ELT (Extract, Load, Transform)
ELT is a more modern approach that takes advantage of the processing power of today’s data warehouses. In ELT, the order of the last two steps is reversed:
- Extract: Data is gathered from all available sources, similar to ETL.
- Load: The raw data is immediately loaded into the data warehouse without initial processing.
- Transform: Transformation occurs within the data warehouse, leveraging its powerful computing capabilities.
This approach is beneficial for quickly handling vast amounts of data, reducing the time data spends in transit. ELT is particularly effective when using cloud-based data warehouses that can scale to handle large processing loads. It’s a better choice for real-time data analysis and big data applications.
Choosing Between ETL and ELT
The choice between ETL and ELT depends on several factors:
- Data Volume: ELT might be more suitable for handling large datasets efficiently.
- Processing Power: If your data warehouse can handle complex transformations, ELT could leverage its capabilities to speed up processing.
- Data Quality Needs: ETL provides an opportunity to clean and validate data before it enters the data warehouse, which might be crucial for some businesses.
- Real-time Data Needs: ELT supports quicker availability of data for analysis, which is beneficial for real-time decision-making.
Understanding these differences and evaluating your organization’s specific needs will guide you in choosing the most appropriate method for your data warehouse project.
Our Choice
We went with ELT. We use data connectors that move the data directly into our Warehouse without making any transformations in between for a straightforward reason: we don’t want to limit or assume what we will do with the raw data afterward.
We don’t need to limit the data we’re moving or storing since we use cloud functions and a robust cloud database. This is awesome because we don’t necessarily need to infer (and thus, limit) what we will do with that data: we have it all available for later querying and insight-gathering.
The Components
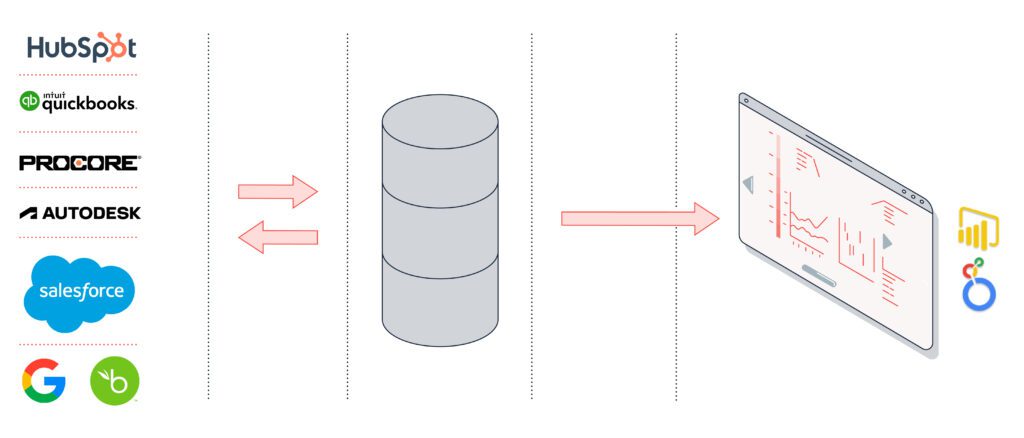
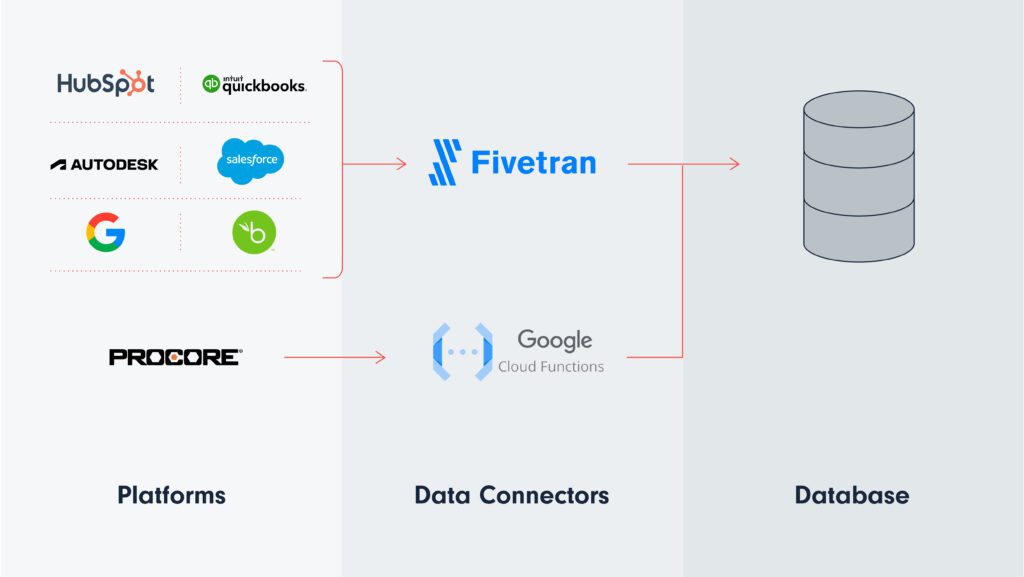
There will be several components going into your Data Warehouse. To quote one of our previous articles:
- The platforms where data is generated. You probably already have these; they’re the daily tools you use! We’ll dive into them soon.
- Some data connectors. Some providers take care of this, but depending on your technical expertise, you can also tackle them on your own.
- A big database with multiple datasets is the heart of your Data Warehouse. It’s where you will actually store your data.
- A data visualization platform that updates in real-time. This is the BI (business intelligence) part, as they call it. This is where you build dashboards and gather insights from all the hard work you did to build your Warehouse.
Selecting Your Tech Stack
Given the many options available, choosing the right technology stack for your data warehouse can be daunting. Factors to consider include cost, scalability, compatibility with existing systems, and your team’s skill set.
We’ll take a look at the components:
1. Platforms
Following our General Contractor example, the platforms might be as follows:
- Building data: Autodesk Construction Cloud
- Financials: Quickbooks
- HR system: BambooHR
- CRM: HubSpot
- Construction management: Procore
- Project management: Asana
These are the daily platforms a General Contractor might use for the different aspects of a business. We’ll need to sync all these to the Warehouse to measure project performance and goal alignment.
2. Data Connectors
Data integration involves collecting data from various sources and providing a unified view.
For this, you use data connectors that move information from the platforms where you generate it to your Warehouse.
In terms of Data Connectors, we’re big fans of Fivetran. They provide pipelines that connect hundreds of platforms to different destinations in a few clicks. And you don’t need to worry about them again. Plus, it’s cheap!
There could be some cases where Fivetran doesn’t gather all the data you need or doesn’t offer support to the specific platform(s) you use. In that case, we’ve built custom cloud functions in Google Cloud that sync up the missing gaps. In our case, that’s Notion and ClickUp. We also used Apps Script as a quick scripting environment where we coded some of these connectors.
As previously explained, these connectors move the raw data from the source (the platform where it’s generated) to the destination (the data warehouse) without making any changes.
Fivetran supports five of the six platforms mentioned in the previous point. That means we can start syncing data from all those platforms to our Warehouse with just a few clicks!
Fivetran doesn’t have support for Procore yet. They may add it soon, but that would be the only connector we would need to tackle manually with a custom-built cloud function hosted in Google Apps Script, Google Cloud, or similar cloud providers.
3. A Big Database
Open-source platforms like PostgreSQL can be cost-effective for small to medium-sized projects. Commercial solutions like Amazon Redshift or Google BigQuery may be more suitable for larger projects requiring robust scalability and advanced features. They’re also easier to set up and deploy since everything is handled in AWS or Google Cloud, respectively.
In our case, we run on Google, so we went with Google Cloud’s BigQuery solution.
Here, we will see all the data from our different connectors organized in different datasets. This is an example from the BigQuery public data project, containing datasets about public health, the Bitcoin blockchain, mobile coverage, etc.:
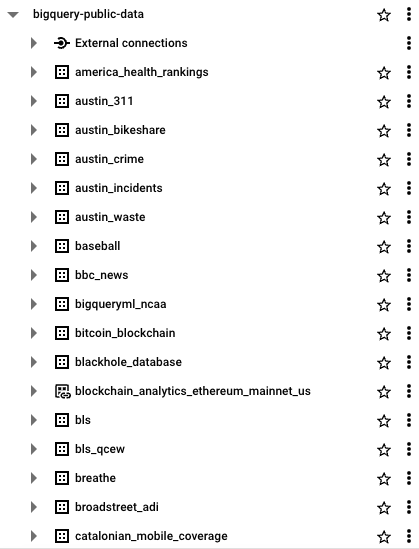
Each of these has different tables inside.
Step-by-Step Setup
For our example and using our approach, our hypothetical General Contractor would only need to:
- Get a Google Workspace account and access Google Cloud.
- Create a project to use BigQuery.
- Create an account with Fivetran.
- Set up connectors for all the sources (ACC, Quickbooks, BambooHR, HubSpot, and Asana) in just a few clicks.
- Wait a few minutes, and done! The data is synced and will continue syncing to your Warehouse as periodically as you set it up. It could sync every 15 minutes or every day, for example.
This means you can set up your initial warehouse in a matter of minutes.
Leveraging Your Data for Decision-Making
Once your data warehouse is up and running, it’s time to leverage it for decision-making. Data visualization tools like Tableau, Looker, or Power BI can help bring your data to life and make it more understandable.
In our example, we used Google BigQuery, so Looker might be the best option since it belongs to the Google ecosystem.
This part is more challenging since it requires knowledge of data. Our entire setup so far was quick and with a few clicks, but from now on, building dashboards and the right queries to feed them can be tricky.
In our case, a query to measure project efficiency and build a report similar to the image below mixes data from sales, accounting, and project management/operations at the same time, providing project-level insights as well as a general efficiency gauge:
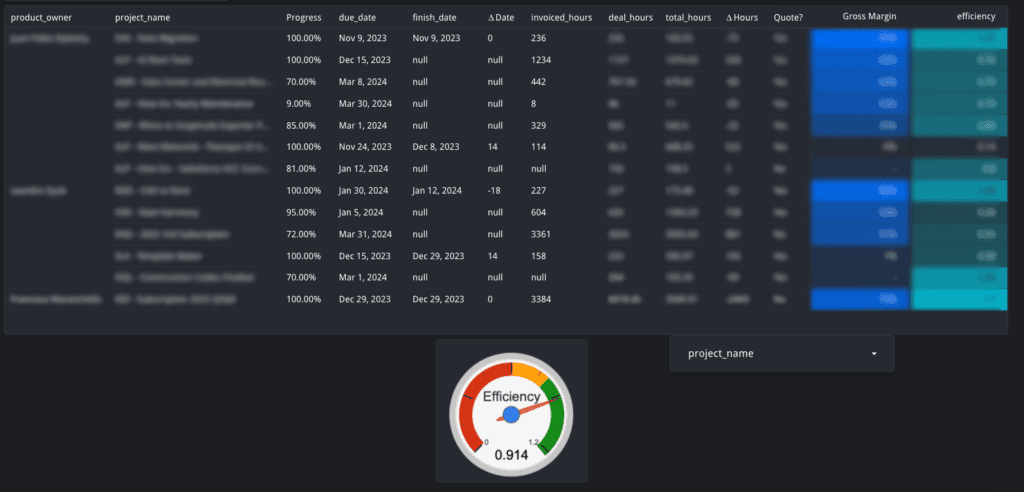
Here’s an example of the types of queries you could build to create the sample report above, mixing data from all the areas in your company and the platforms you use in the same place. It can get complex. Note the query is generic and with anonymized data:
					SELECT
  project_id,
  project_status,
  percent_completed,
  efficiency_rate,
  performance_efficiency,
  net_project_margin_percentage,
  project_outcome,
  extra_hours_used,
  schedule_variance,
  completion_quarter,
  project_manager
FROM (
  SELECT
    p.project_id,
    p.project_status,
    p.percent_completed,
    ROUND(p.calculated_hours / NULLIF(p.total_hours, 0), 2) AS efficiency_rate,
    ROUND(p.percent_completed * p.estimated_hours / NULLIF(p.total_hours, 0), 2) AS performance_efficiency,
    ROUND((p.expenses - IFNULL(p.labor_cost, 0) - IFNULL(p.material_cost, 0)) / NULLIF(p.expenses, 0), 2) AS net_project_margin_percentage,
    CASE
      WHEN p.project_status = 'Completed' AND p.percent_completed <> 1 THEN 'Incomplete'
      WHEN p.efficiency_rate < 0.90 AND p.project_status = 'Completed' THEN 'Over Budget'
      WHEN p.project_status = 'Completed' THEN 'Successful'
    END AS project_outcome,
    CASE
      WHEN p.total_hours > p.estimated_hours AND p.project_status = 'Completed' THEN ROUND(p.total_hours - p.estimated_hours, 1)
    END AS extra_hours_used,
    DATE_DIFF(p.project_completion_date, p.project_due_date, DAY) AS schedule_variance,
    LAST_DAY(p.project_completion_date, QUARTER) AS completion_quarter,
    p.project_manager
  FROM (
    SELECT
      project_id,
      project_status,
      percent_completed,
      estimated_hours,
      total_hours,
      ROUND(expenses / hourly_rate, 2) AS calculated_hours,
      expenses,
      labor_cost,
      material_cost,
      project_start_date,
      project_due_date,
      project_completion_date,
      project_manager
    FROM your_project_table
    -- Assume this subquery aggregates data from multiple sources,
    -- calculating total hours, expenses, etc.
  ) p
) aggregated_data
ORDER BY project_id;
Some of the things included in the example:
- Project Metrics Calculation: It calculates efficiency rates, performance efficiency, and net project margin percentages based on parameters such as how much you sold the project for, how much it cost you, and whether it went over or under budget.
- Outcome Determination: Uses
CASEstatements to assess the project outcome as ‘Incomplete’, ‘Over Budget’, or ‘Successful’ based on the project’s status and calculated efficiency. - Schedule and Budget Variance: Calculates extra hours used if a project goes beyond estimated hours and determines the schedule variance by comparing the project’s actual completion date to the originally planned due date.
- Aggregated Subquery: The inner subquery (
FROM your_project_table) is a placeholder for the actual data source. This subquery represents the part of the query where data from various tables would typically be joined and aggregated to calculate metrics like total hours, expenses, labor costs, etc. It’s simplified here for the example.
By combining these metrics and evaluations, the query provides a comprehensive overview of project performance, allowing General Contractors to identify areas for improvement, measure project outcomes against estimates, and track financial performance.
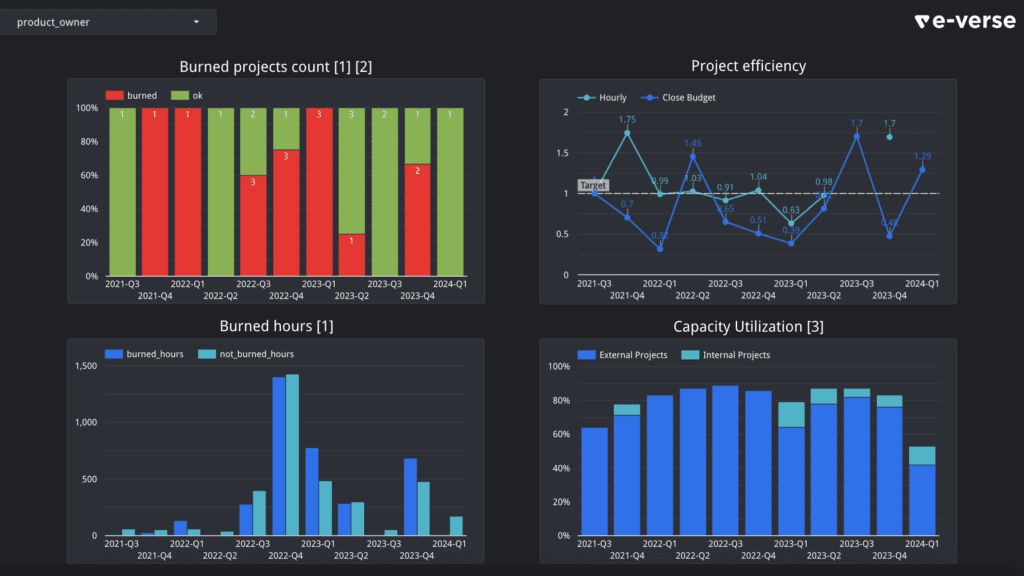
This report with sample data feeds from a similar query, displaying project efficiencies across time and resource capacity utilization for external and internal projects.
It’s awesome that you can mix and use all this data from different places to gather broader insights about your business. Also, under this approach, your reports will automatically update to reflect the latest data! Well, according to your Fivetran setup, at least every x number of minutes.
Leveraging Your Data for Process Automation
Invoicing
Another interesting set of use cases besides BI and reporting that don’t get mentioned often enough is automating processes.
In our example, we would already have data on projects, completion percentages, financials, and sales deals, which means we can automate our invoicing process.
A sample workflow that we could build on top of our existing infrastructure could be:
- A cloud function that runs on a time trigger on the last day of each month.
- It messages the project PM with a summary of the projects they’re leading, their progress, and their status.
- It allows the PM to check which ones they want to invoice.
- It sends the invoices to the client.
This is very simple to build with a few lines of code. The hard part is what we already have: the infrastructure and data processes to support it. Our warehouse already has data on all the areas needed: projects, their PMs, progress, the original sales deal, client information, and financial information like how much was previously invoiced, how much is pending, etc.
Forecasting and Estimating
Forecasting and estimating are other great use cases. Having an easy way to visualize and understand your actual performance compared to what you initially estimated is a great way to learn and constantly improve for future projects.
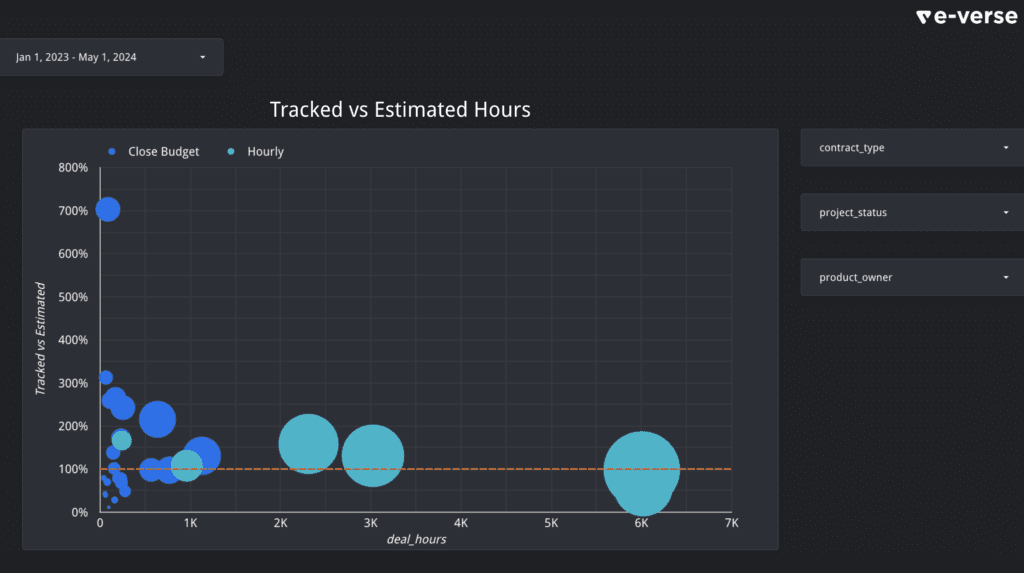
This report with sample data displays how different projects performed vs. what was estimated for them, along with their nominal size (bigger circles mean bigger projects). The orange line represents 100% accuracy, where the time estimated was equal to the actual time spent on the project.
Other Use Cases for General Contractors
Beyond project performance analysis, reporting, and process automation, a well-designed data warehouse can open up numerous other opportunities for a General Contractor.
Here are a few examples:
- Risk management and safety monitoring through integrated dashboards and alerts.
- Supply chain optimization to identify cost savings, streamline logistics, and ensure timely material delivery.
- Subcontractor performance tracking to monitor adherence to schedules, quality of work, and contractual obligations.
- Maintenance and operations improvement using predictive maintenance models to reduce downtime and maximize asset lifespan.
- Client relationship management by integrating CRM, project management, and financial data for better customer service and upselling opportunities.
- Internal process optimization and automation, creating workflows for work applicants, managing HR data and reporting.
The article emphasizes that these examples are just a few of the many potential use cases a data warehouse can enable for a General Contractor. As the data warehouse matures and incorporates more data sources, it may uncover further opportunities to enhance efficiency, mitigate risks, and improve organizational decision-making.
Continuous Discovery
These are just a few examples of the potential use cases that a well-designed data warehouse can enable for a General Contractor. As your data warehouse matures and you continue integrating more data sources, you may uncover more opportunities to drive efficiency, mitigate risks, and enhance decision-making across your organization.
Conclusion
Building your data warehouse is no small feat. It requires a clear understanding of your business needs and a thoughtful technology selection. However, the rewards can be immense. A well-designed data warehouse empowers an organization to make informed decisions, uncover hidden insights, and drive strategic initiatives.
If you’re not a GC and want to see examples for your specific role in the industry, please let us know! We’d love to hear from you.

Francisco Maranchello
A proactive entrepreneur at heart who constantly seeks new challenges. As an Architect who codes, I have broadened my skill set through a passion for technology and innovation. I believe technology is the future of architecture and the built world. Always learning and leveraging cutting-edge technologies to seek new answers, I bring a holistic approach when facing new challenges.