The AU 2022 in numbers

How AU attendees respond to what Autodesk has to offer?
This is the second part of a series where we talk about the AU from a data-driven perspective.
In this article, we wanted to research the market behind Autodesk’s decision to accept a talk and how the public receives this decision.
What data do we have?
We stumbled upon a nice GraphQL endpoint on a previous version of the event web page (no longer available as a web but still accessible from a query)-.
With it, we were able to pull 72 of the 440 classes available this year.
We got technical classes, handouts, general sessions, etc. – their titles, descriptions, categories, schedules, and even some numbers that, taking into account what the API says, correspond with the classes’ attendees!
⚠️ Disclaimer: We don’t know where some of this data is coming from -Autodesk, Swapcard, or any other event platform provider- but we are going to consider it real for the sake of this exercise.
Asking the Big Questions
Working with graphics and data requires you to have an editorial opinion, or a hypothesis expressing your intentions behind the search for information.
In our case, our journey is driven by these 3 questions:
- What is Autodesk’s primary market?
- How is this reflected in the Autodesk University event?
- How did the public respond to Autodesk’s offer?
Autodesk sales numbers are available in their investor’s reports, deliver every quarter
We will try to answer the last two questions by comparing the offer and the demand for classes. Again take this with a grain of salt, we are only comparing classes with attendees’ information available.
What’s Autodesk’s primary market?
During the last 10 years, Autodesk’s main attention has been on the AEC market. Most of the products offered by the company are focused on this industry and make up more than 1/3 of the total revenue.
If we look at the numbers product-wise, we can see AutoCAD leading the revenues with it’s own category.
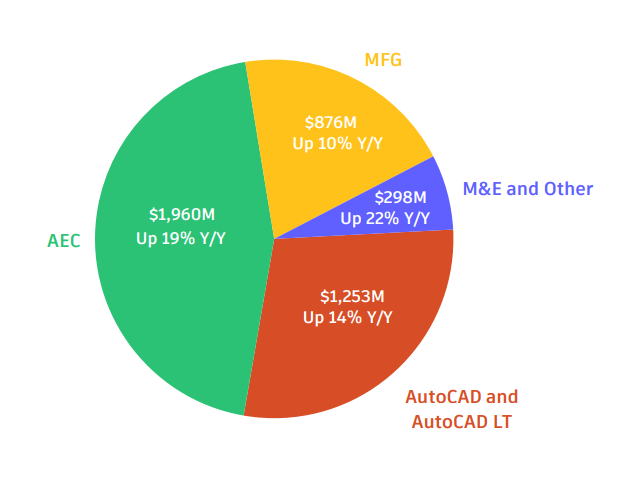
For reference: AEC – Architecture Engineering & Construction, M&E – Media and Entertainment and MFG – Manufacturing.
Below, you’ll find the revenues from the last 5 years and we can see a 100% increment in the numbers from AEC products & AutoCAD.
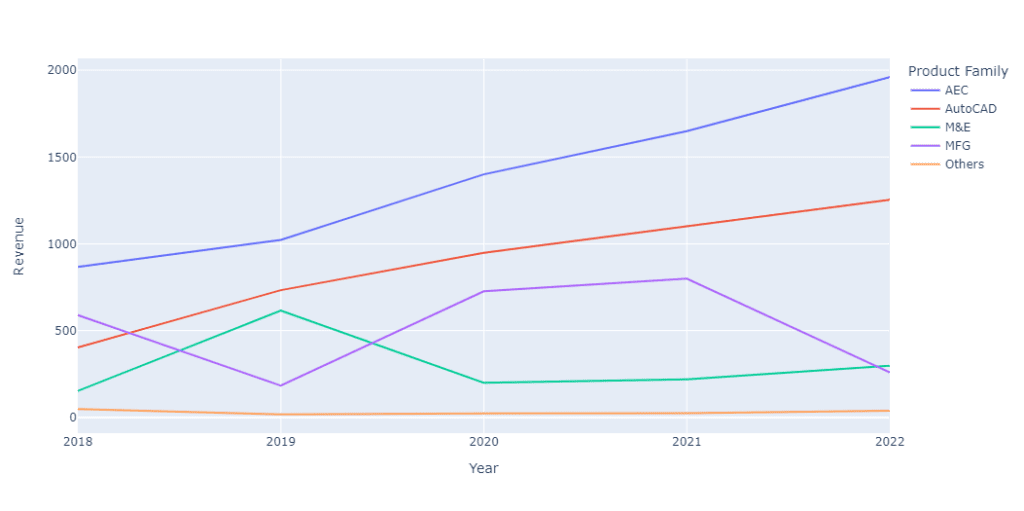
How do these numbers align with what Autodesk offers in the AU?
Attendees per day
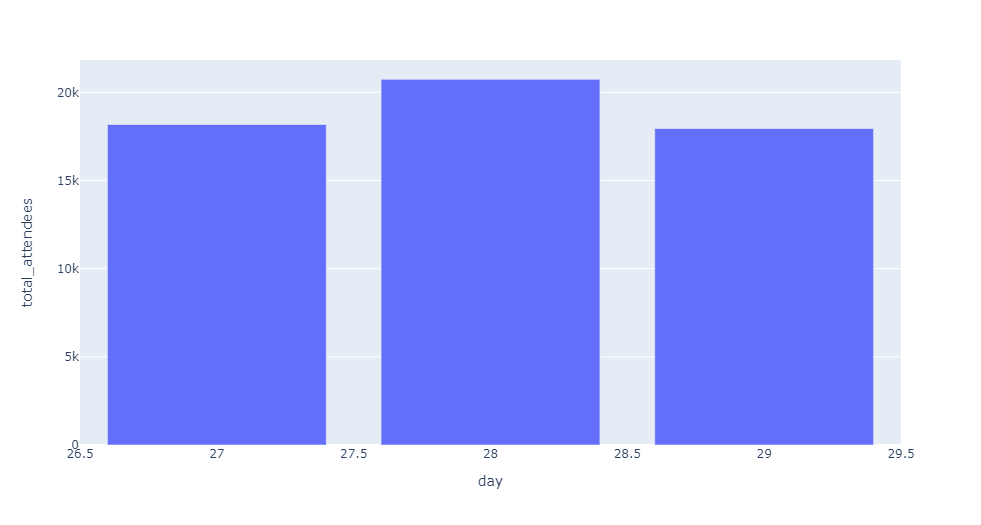
First, let’s see the distribution of attendees during the event to gain some context.
According to the data, September 28th 2022 was the most popular day for classes, more than 20k attendees got to one or more. The 27th and 29th were “slower” days with 18.2k and 17.9k respectively.
Remember that these are not unique attendees but the sum of all attendees per class per day.
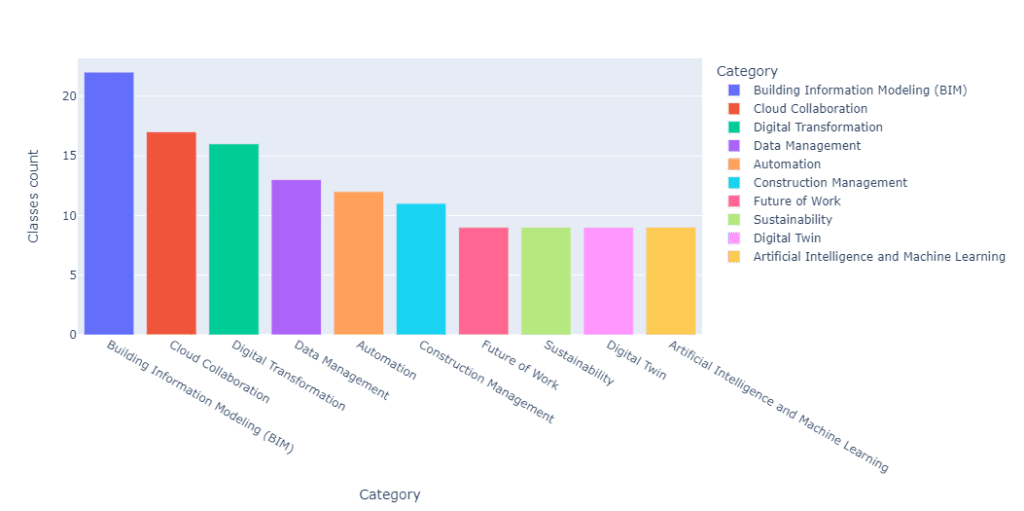
Classes categories
From the offer side, and being a surprise to no one, BIM was the most popular category used by the speakers. Below, you can see a graphic showing the top 10 categories from the AU dataset.
Note the keyword “Digital” popping here and there.
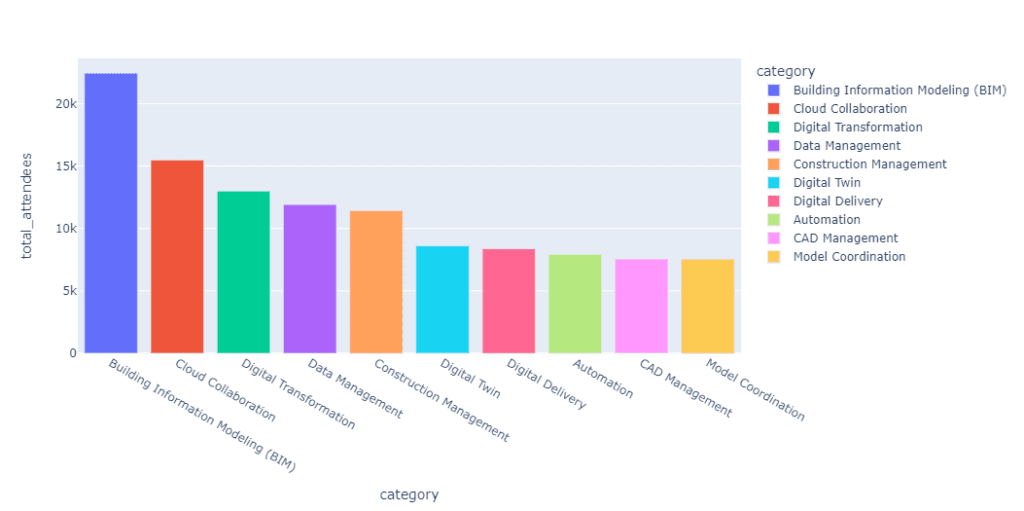
The audience was pretty much aligned with the offer showing only a few outliers.
Future of Work and AI/ML were two topics of interest for the attendees.
Classes by industry
Since the final Autodesk classes were published (A data-driven approach to create a killer AU talk) the information returned by the endpoint we consumed changed and some data is now missing. But we manage to save information related to the industry tag associated with each class.
Below, we can see again an almost perfect match between the offer and demand of classes.
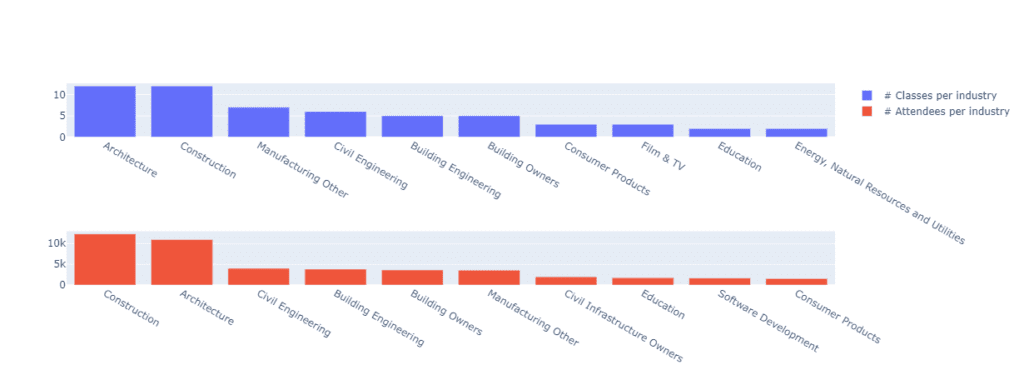
One of the differences we see between the top (classes offer) and the bottom graphs (classes demand) that attendees show interest in Software Development.
We suspect this could be related to the Future of Work and AI/ML we saw in the previous point, reflecting a need of the industry for custom solutions.
Conclusions
As we mentioned before, this dataset only exposes 72 of the 440+ classes on the AU this year.
But we think we can extrapolate conclusions based on partial information.
- Autodesk University is a reflection of what Autodesk is seeing as its main market. The AEC industry leads the classes year by year (See A data-driven approach to create a killer AU talk).
- Attendees are responding to this offer looking for classes related to the industry.
- If we group Future of work, AI/ML, Automations under a common umbrella, like “a search for new technology”, we may see a tendency of attendees to look to create new solutions besides the products currently offered.
You are probably thinking about other ways to squeeze the data, feel free to use it to model your own graphics.
https://colab.research.google.com/drive/1PnsG6BYl7MBJX6XllEEL2uhCfirs3RzM?usp=sharing
Share your conclusions with us!

Pablo Derendinger
https://www.e-verse.comI'm an Architect who decided to make his life easier by coding. Curious by nature, I approach challenges armed with lateral thinking and a few humble programming skills. Love to work with passioned people and push the boundaries of the industry. Bring me your problems/Impossible is possible, but it takes more time.