01
Displaying Data Visualization with Efficiency
Data visualization is the graphical representation of information and data. Using data visualization tools with grapich elements like charts, graphs, and maps provides an accessible way to see and understand trends, outliers, and patterns in data.
Additionally, it is an excellent way for employees or business owners to display data to non-technical audiences without confusion.
In our increasingly data-driven world, it’s more important than ever to have accessible ways to visualize data. Employees and business owners at every level need to understand data and its impact.
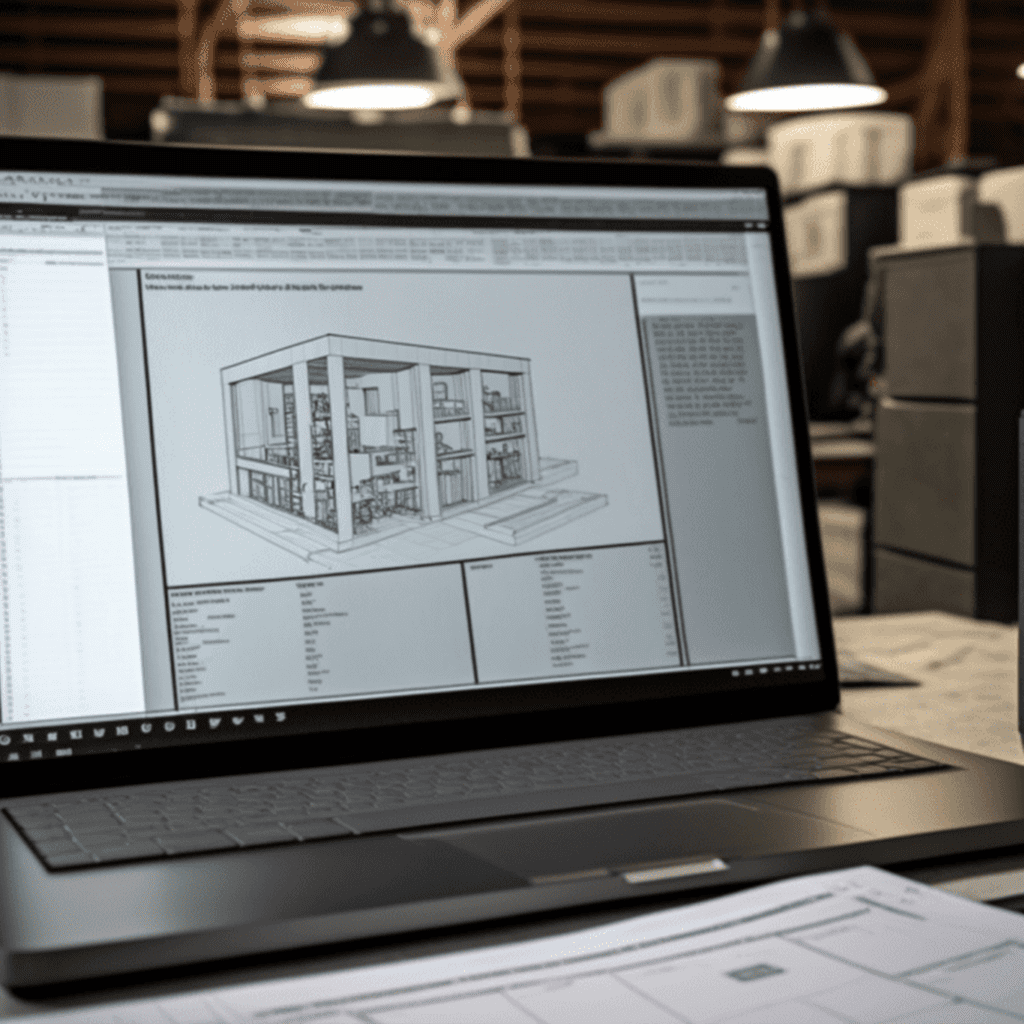
We are in the age of Big Data and the construction industry is no exception. Visual representation is an increasingly crucial tool to make sense of the trillions of rows of data generated every day. Managing and visualizing your BIM data helps to tell stories by curating data into a form that is easier to understand, highlighting the helpful information and removing the noise from data.
02
BIM Dashboard: The e-verse way
As architects and engineers at e-verse, we are AEC professionals that know precisely the impact of a good visualization of a building. For that reason, we combine that deep knowledge with our coding skills to display custom data in the most impressive and innovative ways.
Leverage the visual real-time construction data and Improve your business.
02
Construction Software Development: Key Benefits
- Provides clarity and a better understanding of the information.
- Gives many advantages when making decisions
- Increases the impact to realese your product to the market
- Provides an accessible way to share important information within your teams!
- Presents visual elements into charts, graphs, and maps.
03
API for Data Visualization
At e-verse, each project is unique, and based on that, we select the most optimal visualization tool during the data integration consulting. No one size fits all data sources or projects, so we work with multiple frameworks, libraries, and software.
We can work with the specifics of libraries like Matplotlib, the amazing graphics of Plotly, the simplicity of Chart.Js or even with robust solutions like Power BI or Tableau.

Power BI

Looker Studio

Tableau
Plotly

MatplotLib


06
Case Study
Field Genie
Fabrication Tools
07
Stats
While industries like Manufacturing and Agriculture have greatly increased productivity in the latest decades, the construction industry has barely improved in comparison, so this shows us the great opportunity we have in our hands.

**Vian Ahmed, Algan Tezel, Zeeshan Aziz, Magda Sibley (2017), “The future of Big Data in facilities**
**Management: opportunities and challenges”, Facilities, Vol. 35 Issue: 13/14, pp.725-745**
Even with the current situation of the construction industry where there is a lack of innovation, construction firms and construction services firms value more the strategic value of big data analytics compared to other factors like data complexity, compatibility, or even technology readiness.

Chaurasia, S. S., & Verma, S. (2020). Strategic determinants of big data analytics in the AEC sector: a multi-perspective framework. Construction Economics and Building, 20
http://doi.org/10.5130/AJCEB.v20i4.6649