How we use our Data Warehouse to make decisions

Introduction
We have previously talked about our Data Warehouse in broad terms. There, we exposed some concepts and explained why it’s beneficial to have a Data Warehouse running.
Since then, we’ve kept evolving our internal infrastructure, connected more datasets, built more reports, and developed a framework for goal setting for e-verse. We’re at the final stages of building a data warehouse: using its data to produce reports displaying KPIs, measure goals, and ultimately make decisions.
We invite you to take a glimpse!
We will look at the components that make up our Data Warehouse and how that empowers our goals framework and overall decision making.
The Components
- The platforms where data is generated
- Some data connectors
- A big database with multiple datasets
- A data visualization platform that updates in real-time
1. The platforms
We use these day-to-day platforms: HubSpot, Google Workspace, ClickUp, GitHub, Slack, BambooHR, Quickbooks, and others.
The approach many companies have is that people do their daily work, and after they do it, they build reports to show progress in a given frequency to their manager, executive team, or whoever it may be. So, to name one of the many possible examples, an accountant may load up invoices, make payments to vendors, pay the staff for their work on different projects, etc. Then, at the end of the month, build reports for the CFO displaying how much they spent paying vendors on a project. Didn’t they already input this data somewhere in the company ecosystem? We must strongly argue that this is redundant, tedious, error-prone, and unnecessary.
We base our approach on a simple concept: eliminate all redundancy and extra work associated with performance measurement. We stop at “people do their daily work”. If something was input somewhere, at least once (and, ideally, it should happen exactly once), then reinserting that same data somewhere else is redundant and should be avoided.
What does this mean? In the previous example, the accountant loads up invoices and makes payments to staff, vendors, etc. Then, in the accounting system (in our case, Quickbooks), this data is picked up and sent to the rest of the ecosystem automatically, saving extra work and potential errors. Another example: a developer is working on a task (ticket) in ClickUp or Jira. They press play in the task timer, do some commits, push them to GitHub, then press stop. They’ve tracked work done on a task and pushed their code to a repository. From here on, that data is too picked up and sent to the rest of the ecosystem
This idea also applies to processes involving multiple areas. Having the data you need empowers cleaner processes with less friction and more automation.
Here’s an illustrative example of a flow diagram showing our sales-production-billing journey along a project lifecycle:
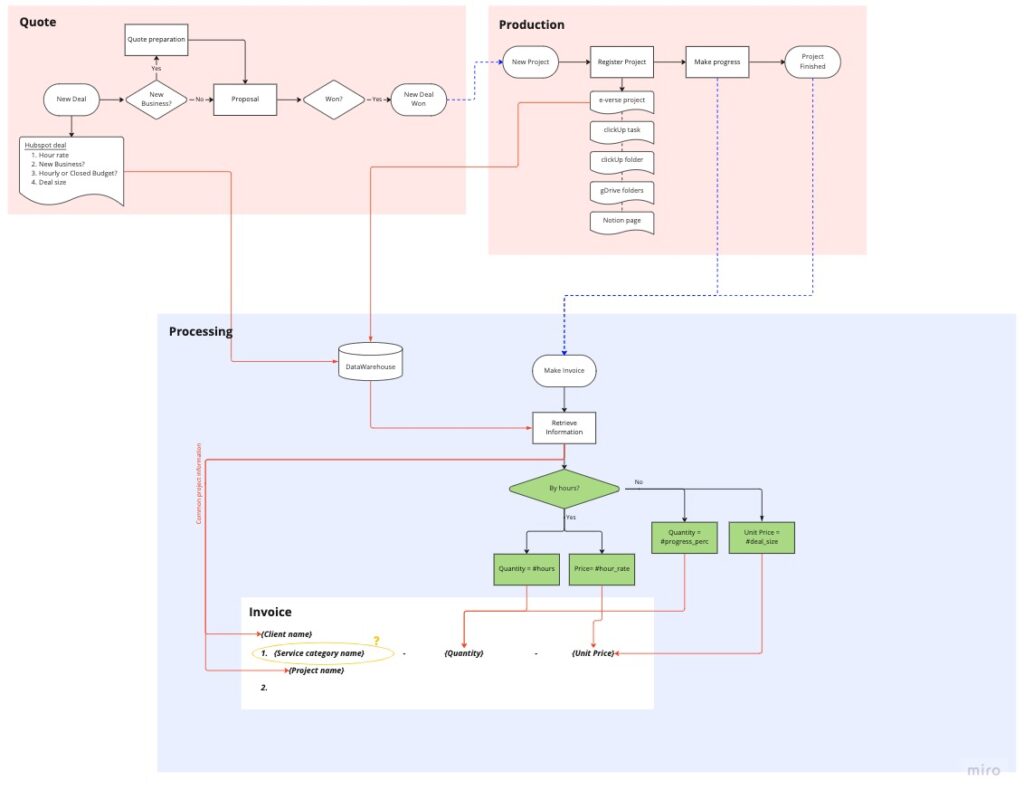
This automatic handover of information from a quote or proposal from sales to production allows teams to deliver the project with the necessary information. Then, it automatically informs accounting of the progress in the project, producing the required invoices along the way for them to be checked and sent with a few clicks. This workflow is only possible when the data from all these areas and systems are integrated and easily queried in a single place.
So, teams of different areas in the company use the platforms they use naturally as part of their daily work, with everything functioning automatically. And that’s it. But really, it’s not. The magic happens behind, largely unnoticed.
2. Data connectors
A key component of our ecosystem is data connectors. Previously, I mentioned data gets picked up and sent to the rest of the ecosystem. Well, these connectors are responsible for that. They listen periodically to any information input into a platform and send any updates found to the central database. So, how do we do this?
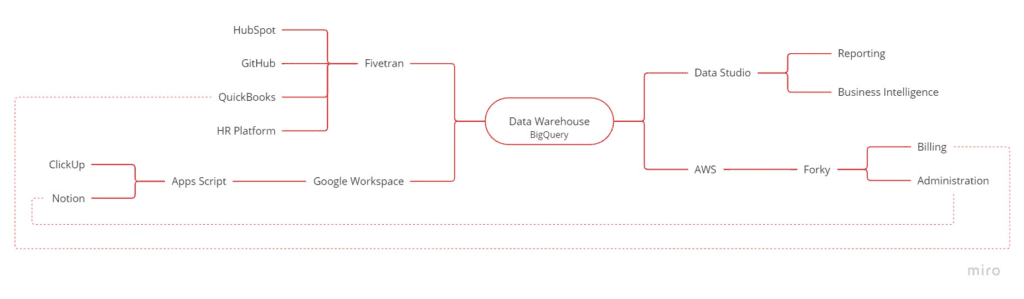
We take it case by case, but, in general, we use a service called Fivetran to connect most platforms. They provide the mechanism to listen to changes on one side and update them on your Warehouse at a given frequency, saving you the hassle of having to code and maintain these connectors. If there are any changes in the APIs used, they keep that in mind and update the connectors to ensure nothing breaks. Fivetran doesn’t support some other platforms. In those cases, we create the connectors ourselves as cloud functions, a topic for another article (or articles!). We use Google Cloud Functions triggered by Fivetran or Google Apps Script.
Here, it’s a quick overview of our connectors today and where we host them:
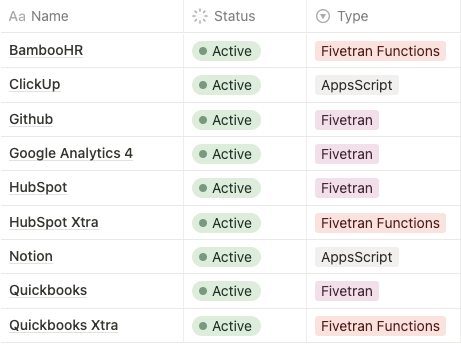
Each of these takes care of syncing a specific dataset whenever changes happen.
3. A big database
At the heart of our Warehouse, there’s an extensive database where everything is stored. Since we run on Google Workspace, we picked BigQuery for the task. BigQuery is essentially a cloud-hosted SQL database on steroids. It allows operations with astronomical amounts of data with a relatively easy setup. Here, the data connectors push changes to different datasets.
These different datasets have multiple tables. One of the most fantastic perks of Google Workspace is its seamless integration between the different platforms across the Google ecosystem, along with its cloud-only approach, where everything is always online, on the cloud, and never stale. Including user groups and permissions, allowing us to manage access using the same groups everywhere.
For example, there’s a Finance user group in our Google Workspace where we include people who work in that area. When that happens, they automatically have access to the corresponding drives and folders in Google Drive, the datasets in BigQuery, the mailing lists in Gmail, etc. There is no need to share anything with individual accounts or create user groups and assign permissions everywhere.
Returning to BigQuery, we can manage granular permissions based on user groups at individual tables, views, or entire dataset levels. Below, there is an illustrative example of how our different datasets look and how they relate to each other:
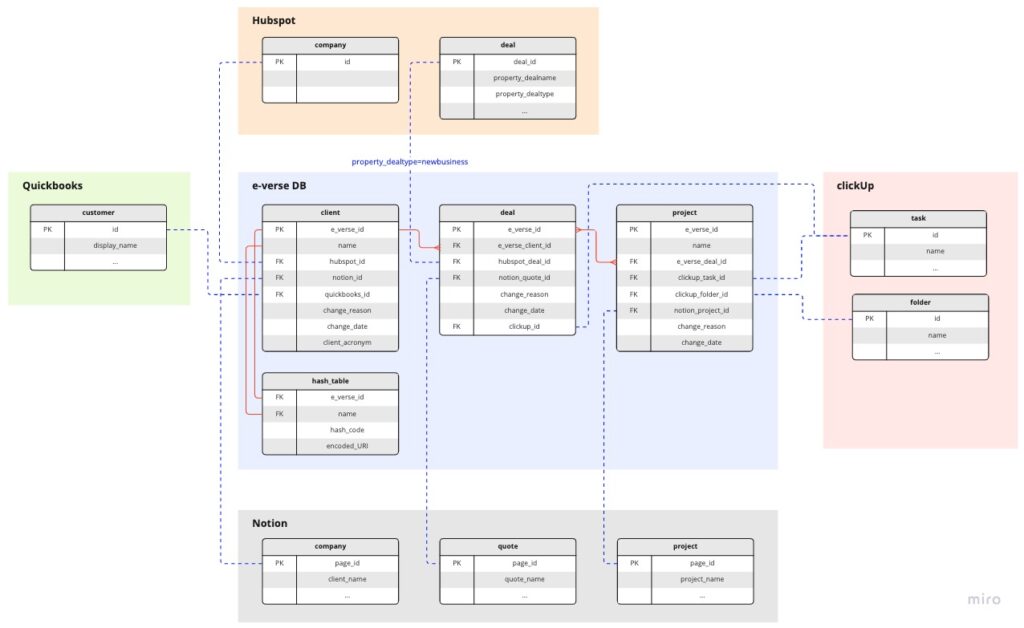
We have built relationships between the same entity or concept across platforms. For example, a project entity can exist simultaneously in Quickbooks, HubSpot, Notion, and ClickUp. Each platform describes or shows different aspects of a project for other purposes (financial, operational, client-wise, etc.).
4. A data visualization platform
So far, we have multiple platforms with connectors pushing stuff to an extensive database. But how do we view this in a helpful way that allows us to infer conclusions? Here, BI tools like Data Studio or PowerBI come in. Again, in our case, we went with Data Studio because, as previously mentioned, it’s always cloud-based and seamlessly integrated.
We generate data in the platforms, send it through connectors to the central database, and automatically read from the reports that update in real-time. People that need access to a report have it since the permission system previously described also applies to Data Studio.
We track report statuses and locations similar to how we track data connectors:
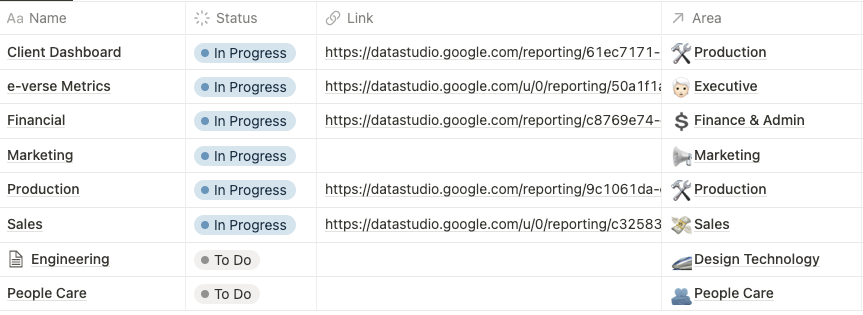
These reports consume different datasets, querying what is needed to measure KPIs. We think about and define what we want/need to measure in a KPI format and then find ways to get to that measurement by combining the data we need or analyzing if we need to integrate any other sources. Then, custom queries are made to the database, generating those metrics and displaying them on the reports. Once we build a report, it’s ready to be used constantly, automatically updating.
We have different types of dashboards, as you can see above in the report tracking table. Some examples include how the various projects are performing in terms of team efficiency, measuring project costs, task types worked on in a given time, and many others:
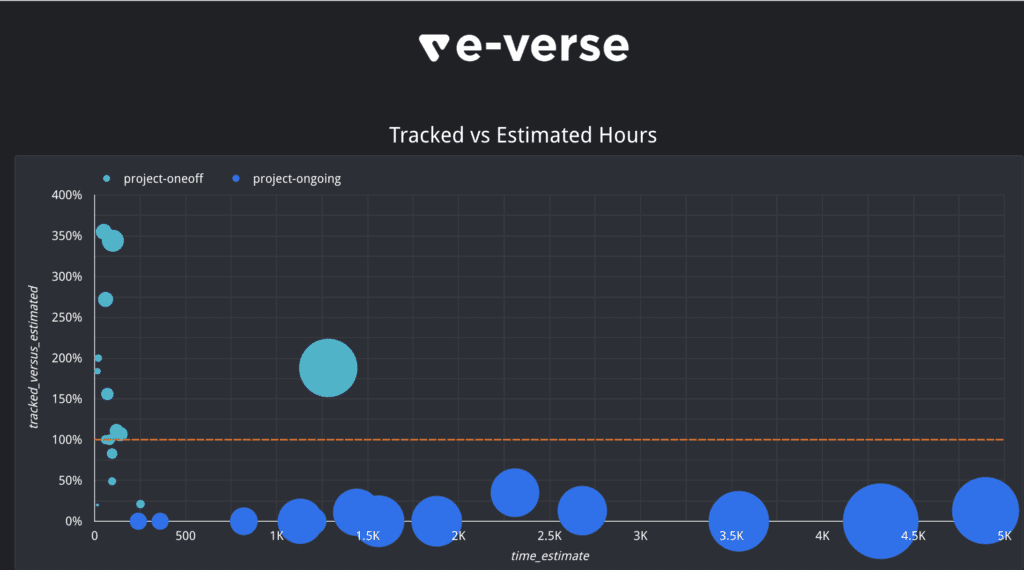
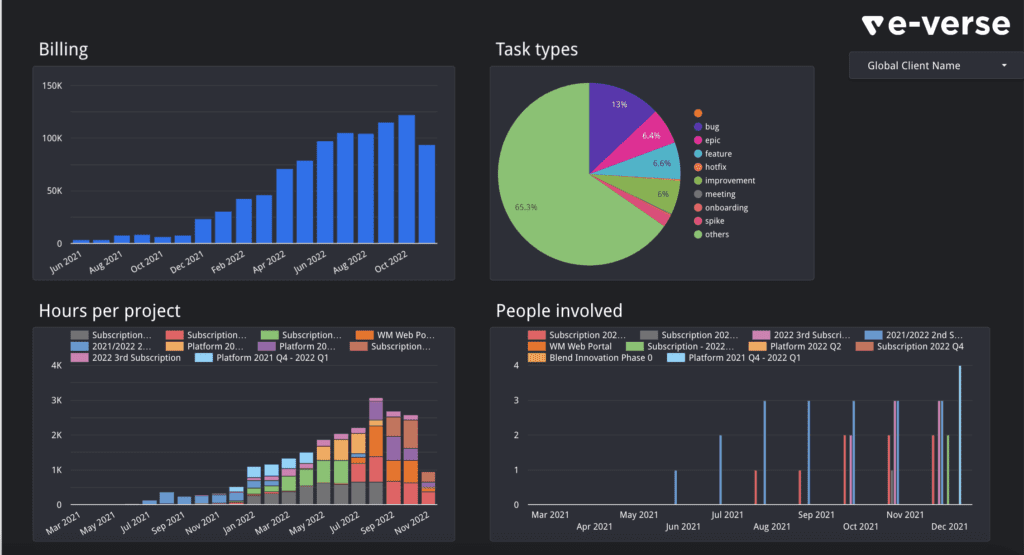
Dashboards empower us to view data helpfully: the last component in our Warehouse. But what do we want to take from that? The Data Warehouse described here is just a tool. It’s just a means to an end. That brings us to the next section.
Our goal framework
The end goal of building a Data Warehouse is to be able to make inferences, measure performance indicators, and make better decisions for the future!
We borrowed the well-known OKR concept (see Measure What Matters from John Doerr) and adapted it to fit our organizational structure and the data ecosystem described here.
I highly recommend studying the OKR concept from a different source since we’re not going to dig too deep into that here. The goal is to describe how we apply it in e-verse:
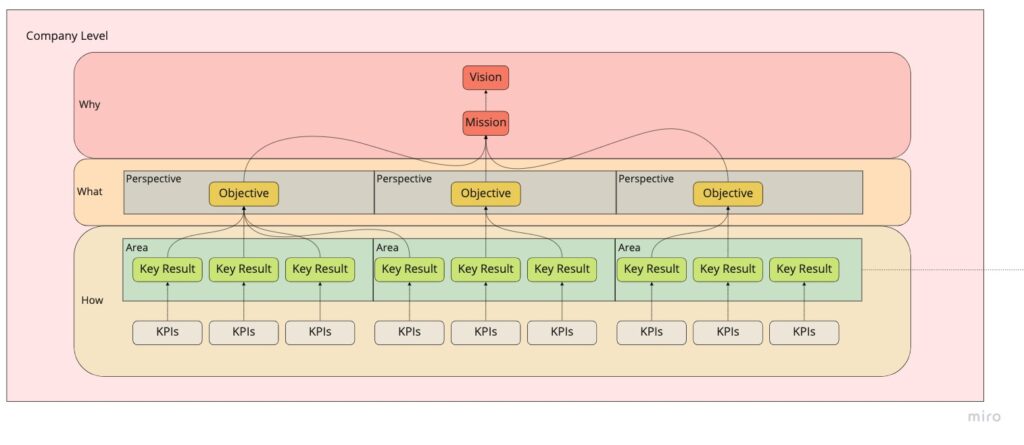
At a company level, there’s a why: our purpose as an organization. It encompasses our Vision and Mission: to change how people interact with buildings.
To keep moving towards that purpose, we must define what we will do to get there. Here, Objectives come in. We mainly set them quarterly by area (or perspective), and they need to be significant, concrete, action-oriented, and inspirational. For example, we aim to create a stable customer journey by the end of Q4 2022. Each Objective has Key Results we need to meet to consider it done.
Key Results are the How: specific actions we’ll take to meet the objectives, how we get to where we want to be. They need to be precise & time-bound, aggressive yet realistic, and measurable and verifiable. Lots of requirements!
Our Objective from the example above has some Key Results. We built this framework in our Notion space as different databases that relate to each other, so here you can see the structure of the example Objective:
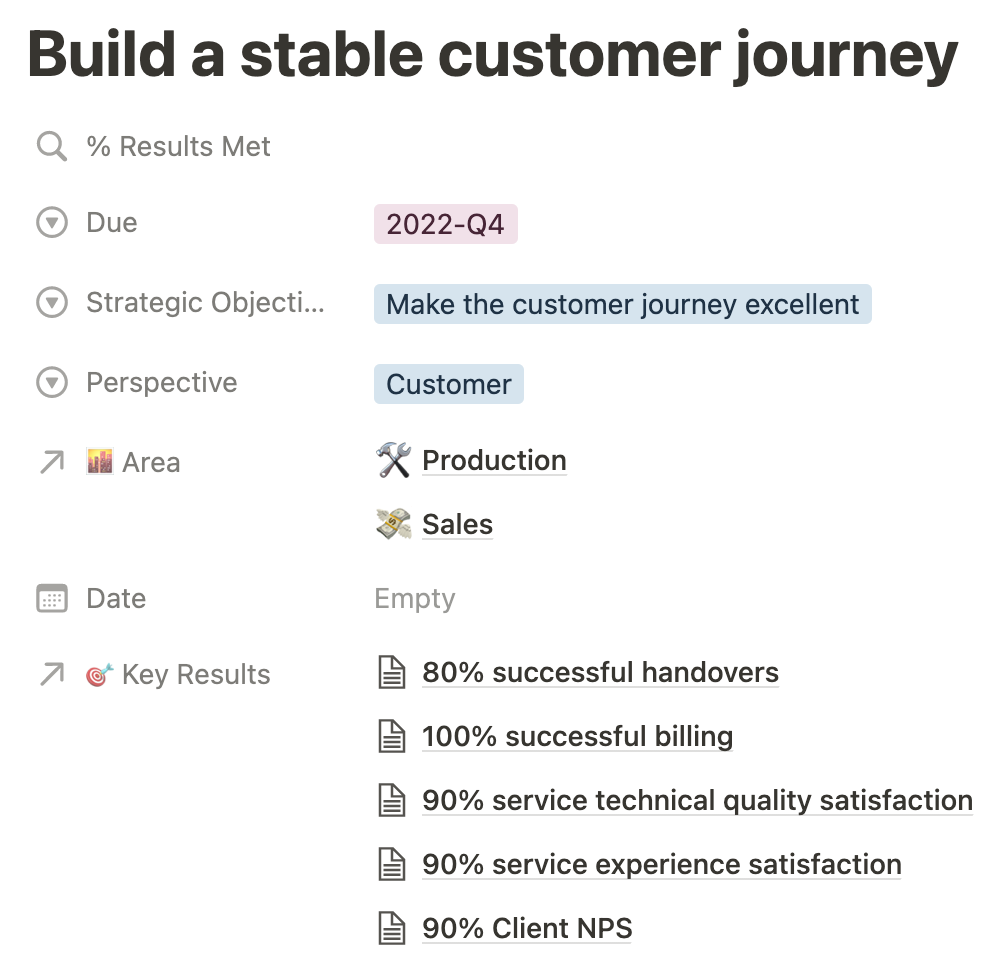
The % of results met is calculated automatically based on the status of the Key Results linked to the Objective, in this case, five.
How do we measure the status of the Key Results? How do we know we met or didn’t meet them?
The previously mentioned KPIs help us do that. As I said, our Warehouse is just a tool that provides us with measurements in the shape of reports filled with different KPIs we defined according to what we want to measure. So, we tie Key Results to KPIs that tell us if we met the quantifiable outcome we wanted. Then, constantly measure KPIs as a snapshot of the performance of some aspect of the company, but Key Results are how we want those metrics to progress in a specific timeframe.
So, to sum it up, we can have a “Client NPS” KPI tied to our Key Result of taking that Client NPS metric to 90% by Q4 2022, which will contribute to completing our Objective of building a stable customer journey.
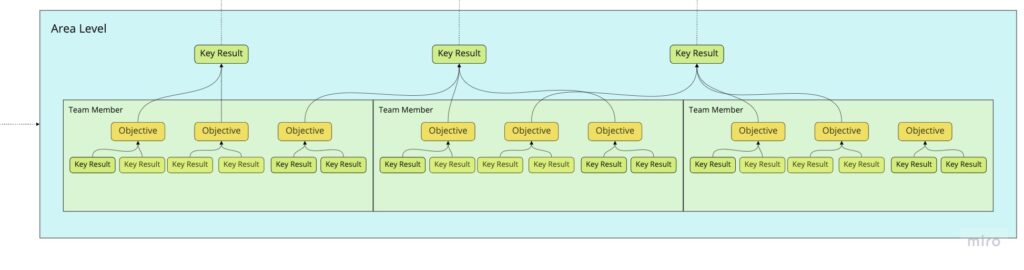
At the same time, continuing with the Company Level schema shown above, these goals impact at an Area Level. Each team member can set their OKRs to contribute to the area’s Key Results for the quarter:
Conclusion
We’ve covered a summary of how we built a Data Warehouse and how we use it to measure performance, set goals, and make decisions. We believe having data initiatives can benefit every organization, regardless of industry or vision, since the formula described here can be applied to any use case, measuring data from any source and defining goals/KPIs. So, we hope our take on the subject brings value to you! If you have different takes on anything here, we’d love to hear them.

Francisco Maranchello
A proactive entrepreneur at heart who constantly seeks new challenges. As an Architect who codes, I have broadened my skill set through a passion for technology and innovation. I believe technology is the future of architecture and the built world. Always learning and leveraging cutting-edge technologies to seek new answers, I bring a holistic approach when facing new challenges.