Neo4j database generated from a Revit model

Introduction
The more the world becomes connected, the more it is important to understand how those connections are built and how we can leverage them to comprehend and predict the behavior of the environment that surrounds us. The area dedicated to studying relationships between entities or individuals is graph theory, which has been used in several areas in the real world, including computational databases such as Neo4j database.
A graph database is a non-relational computational database that exposes a graph data model as a data structure, taking advantage of the graph theory principles, using nodes, relationships, and their properties to represent the data as a network. In the AEC context, graph databases have been applied in different scenarios, like MEP projects, digital twins, and the energy industry, allowing us to better understand patterns, behaviors, and characteristics. In the following sections, we will approach how we can start using graph databases to represent AEC data from the scratch using Autodesk Revit, Neo4j, and a little bit of code.
What is Neo4j?
Neo4j is an open-source, NOSQL, native graph database written in Java and Scala that has been publicly available since 2007. You can check its source code on GitHub.
As a graph database, Neo4j stores data records as nodes, and their relationships and characteristics like type, relevancy, and direction, are represented as line connections.
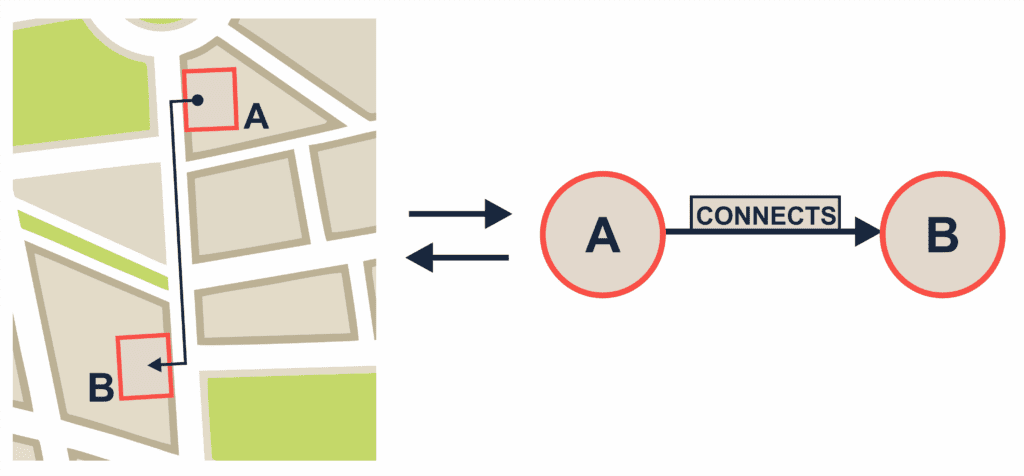
For example, consider two locations in a city, Store A and Bank B. If there is a unique road that connects both locations, the graph that represents them is as follows. Both of them are represented as nodes that can have labels to represent who they are, e.g., point A or location B, and properties that represent their characteristics, e.g., name, length, and type. The relationship between them is represented as a line that connects them and must have a direction (from the start node to the end node), a type (e.g., CONNECTS), and other properties, like speed limit and classification (residential or highway road). To better understand how to use graphs to analyze street networks, we have an article about it! such
With the previous structure, Neo4j allows us to retrieve different metrics and perform complex queries for our data lake using Cypher, a graphs-based declarative query language.
Setting up a Neo4j environment instance from scratch
There are some different approaches to creating a Neo4j instance. Still, one of the simplest uses is the Neo4j Aura DB, which is a free cloud graph database service with a lot of interesting features and services that you can leverage for experimentation and prototyping and can be easily created by following these steps.
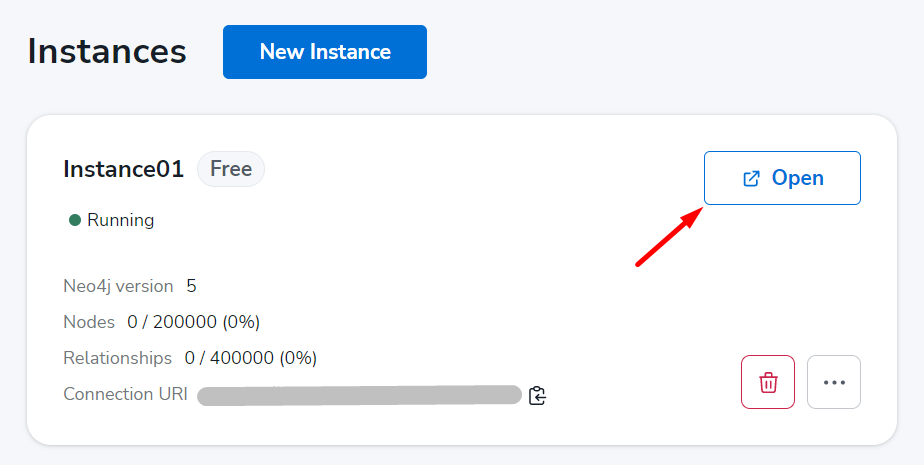
Once you set that up, you should see your instance running like this:
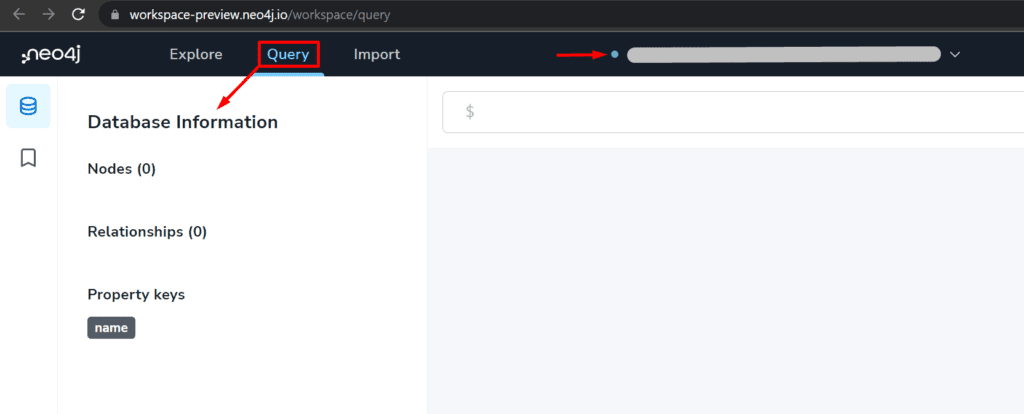
Once you have successfully created your AuraDB instance, it is time to connect it! Notice that to both connect and create queries, you will need to use the browser. Connect your instance and be sure that it is listening to everything from now. The green signal means that everything is going well, and in the ‘Query’ tab, you will be able to see the state of the art of your database in a nutshell, as follows:
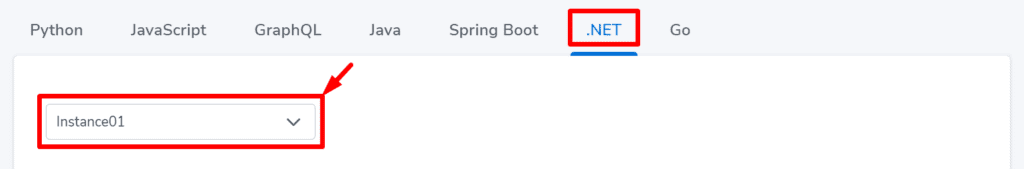
After you have your Neo4j instance created and connected, you can start sending data to it. So the next step is to select a technology to set up your local environment to communicate with your cloud instance. For this, we will move forward with .NET by following these steps. Notice that it is also important to be sure that you’ve selected the desired instance that you want to connect as follows:
Now you have everything you need to start sending data to your Neo4j Aura DB instance.
How to define a relationship among construction elements using the Revit API?
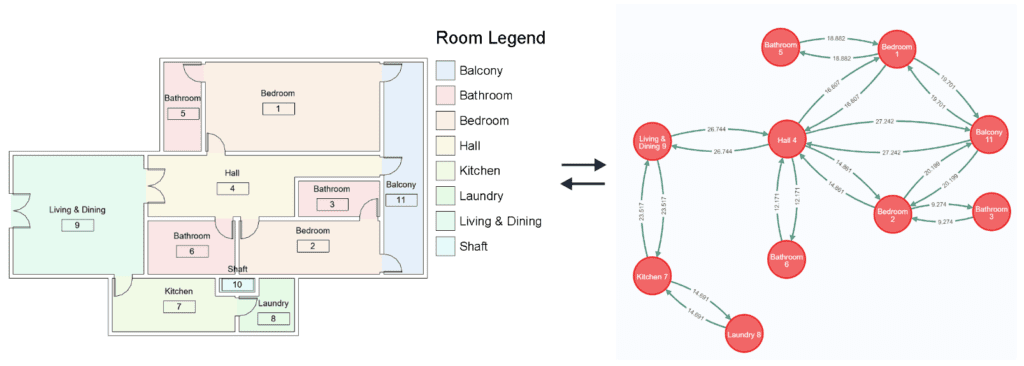
Construction elements are bound to each other by several different perspectives, which allow us to set those relationships as deep and customized as we want. For simplicity’s sake, we will approach an example by parsing the relationship among rooms through the doors that connect them in the Revit model, using the following floor plan:
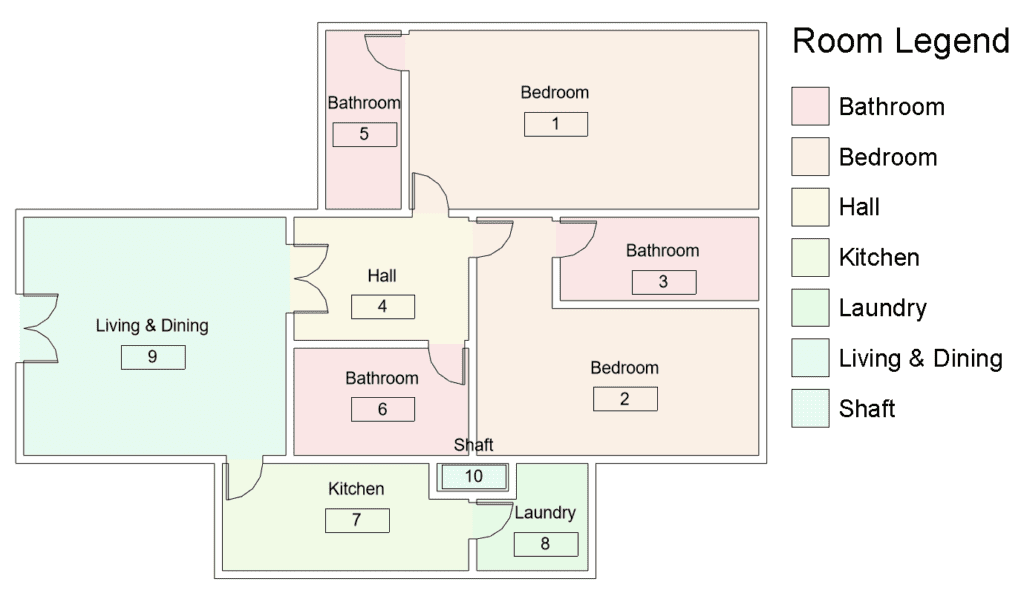
In the Revit API context, to define a connection between two rooms, we can leverage ToRoom and FromRoom door properties, which give us the two rooms whose a given door is in between. That being defined, you can start coding your Revit add-in, which will handle the task of gathering this information from the Revit model and sending it to our cloud database instance through our local environment.
Exporting elements and their relations from a Revit Model to a Neo4j database
Leveraging the structure of the previously defined folder from your Neo4j local environment solution, you can use your favorite IDE to go through the following steps. For further information about the following Revit add-in structure, check **Coding Revit add-ins: the e-verse way:
- Transform the project from the previous step into a Class Library as it was created as a Console Application. To achieve this, you can create a new Class Library project (Neo4j.ClientConnection) and create a file inside of it called Program.cs, with the same content as the Program.cs file from the original solution (Neo4jAuraExample). Remember to delete the original project file and add the Neo4j.Drive reference to this new project as well;
- Add a Class Library (Neo4j.Revit2022) project for each Revit version you want to run inside the solution, using the suitable .NET Framework version for it;
- Add a ****C# Shared Project (Neo4j.Common) and be sure that the Class Library projects use it as a reference;
- Add your Neo4j local environment project (Neo4j.ClientConnection) as a reference for all the Class Library projects you have;
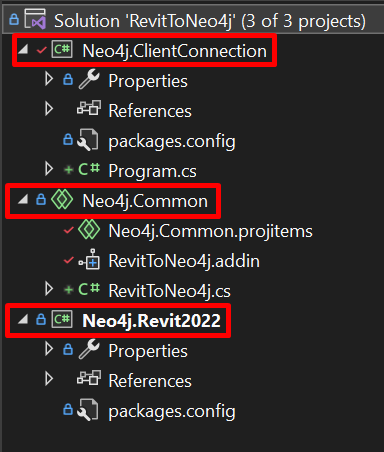
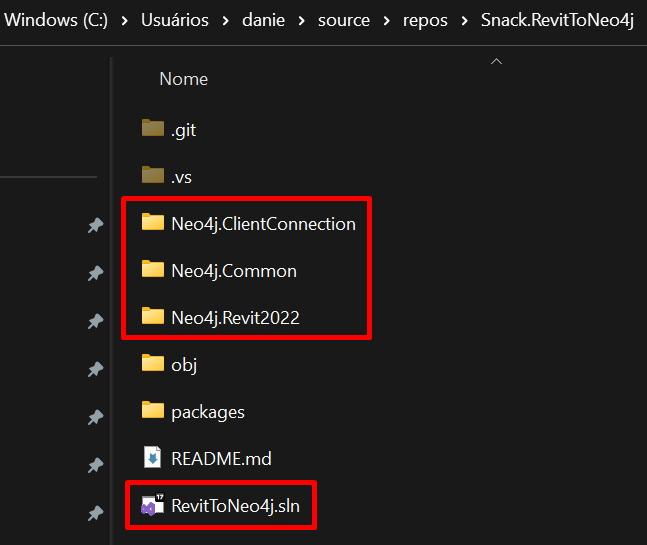
- You should have a solution and folder structured as follows:
6. Add suitable references to build a minimal add-in structure inside the solution. For further information, check our article about it;
7. Create a RevitToNeo4j.cs file into the Neo4j.Common project with the following content;
8. Replace your Program.cs file content with the following one;
9. Notice that into the Program.cs file, you must enter your Neo4j instance credentials, as follows:
					var uri = "<URI>"; // change it, putting your URI!
var user = "<USER>"; // change it, putting your User!
var password = "<PASSWORD>"; // change it, putting your Password!
10. Inside the Neo4j.Common project, create a RevitToNeo4j.addin file with the following content. Notice that the Assembly path location must match your RevitToNeo4j.dll, so you may change it if necessary:
					<?xml version="1.0" encoding="utf-8"?>
<RevitAddIns>
  <AddIn Type="Command">
    <Name>RevitToNeo4j</Name>
    <FullClassName>Neo4j.Common.RevitToNeo4j</FullClassName>
    <Text>RevitToNeo4j</Text>
    <Description>Exports rooms relationships to Neo4j db.</Description>
    <VisibilityMode>AlwaysVisible</VisibilityMode>
    <Assembly>RevitToNeo4j/RevitToNeo4j.dll</Assembly>
    <AddInId>502fe383-2648-4e98-adf8-5e6047f9dc34</AddInId>
    <VendorId>ADSK</VendorId>
    <VendorDescription>Autodesk, Inc, www.autodesk.com</VendorDescription>
  </AddIn>
</RevitAddIns>
11. Finally, be sure that you have the following post-build event on the Debug mode for your Startup Project (Neo4j.Revit2022), taking into consideration the desirable Revit version you want to use:
					if $(ConfigurationName) == Debug mkdir "$(AppData)\Autodesk\Revit\Addins22\RevitToNeo4j\"
if $(ConfigurationName) == Debug copy "$(ProjectDir)$(OutputPath)*.dll" "$(AppData)\Autodesk\Revit\Addins22\RevitToNeo4j\"
if $(ConfigurationName) == Debug copy "$(SolutionDir)Neo4j.Common\*.addin" "$(AppData)\Autodesk\Revit\Addins22"
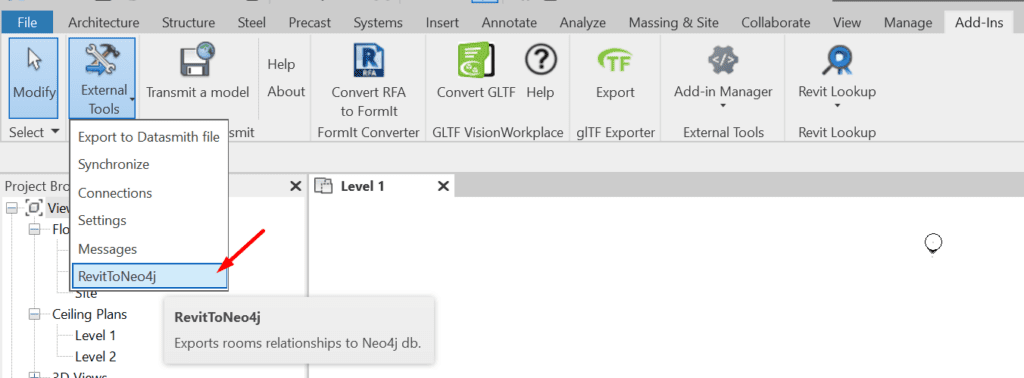
12. That being done, you should have everything to build your project and run Revit. After this, you should see your add-in as follows:
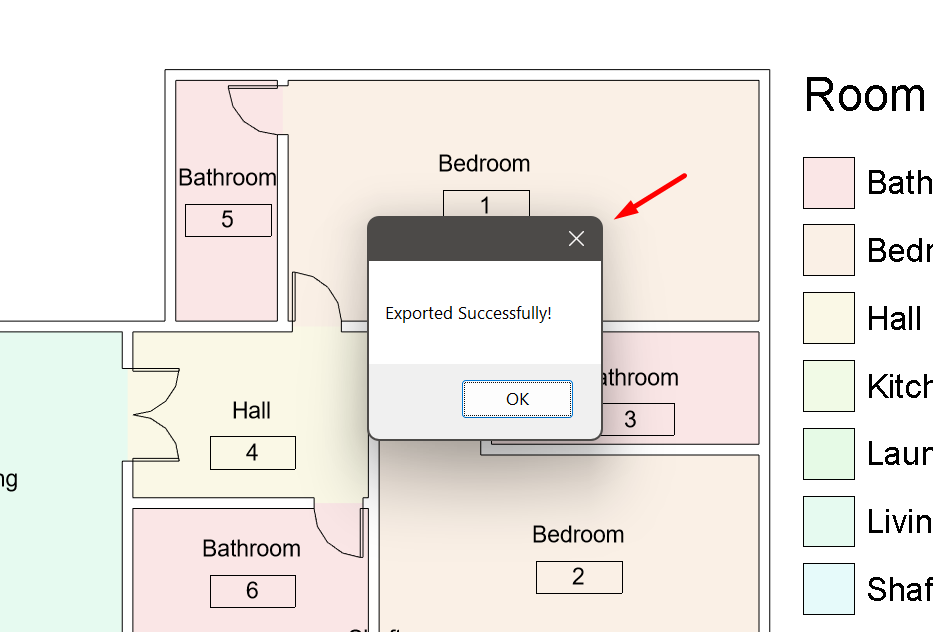
13. Now it is time to export the rooms of your chosen model to the Neo4j DB. Click on the add-in button, and a few seconds later, you will see the following window. Be sure that your doors are storing the FromRoom and ToRoom properties data properly (e.g., without null values where there shouldn’t be):
14. Returning to your Neo4j instance, in the Query tab, you can click on CONNECTS or insert the following Cypher query.
MATCH p=()-[:CONNECTS]->() RETURN p LIMIT 50;
to be able to see the graph model database that represents the connection among the rooms from your Revit model, as follows:
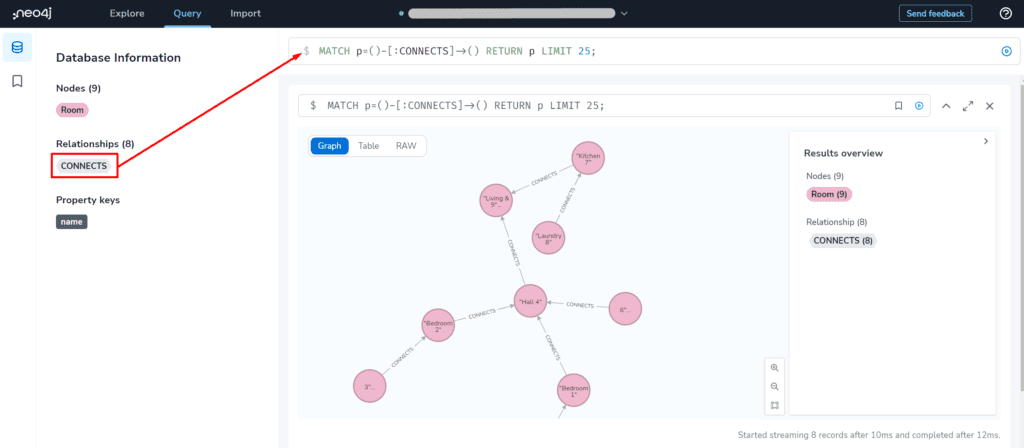
Congrats! You have pushed your first model to the Neo4j database successfully!
Extracting information using graph theory and Neo4j from Revit models
Having done the previous steps, you now have a graph that represents your Revit model’s room relationships in the Neo4j database, similar to what the following image shows. With that, you can start extracting more information from the model, leveraging the graph theory metrics and the Cypher queries in Neo4j.
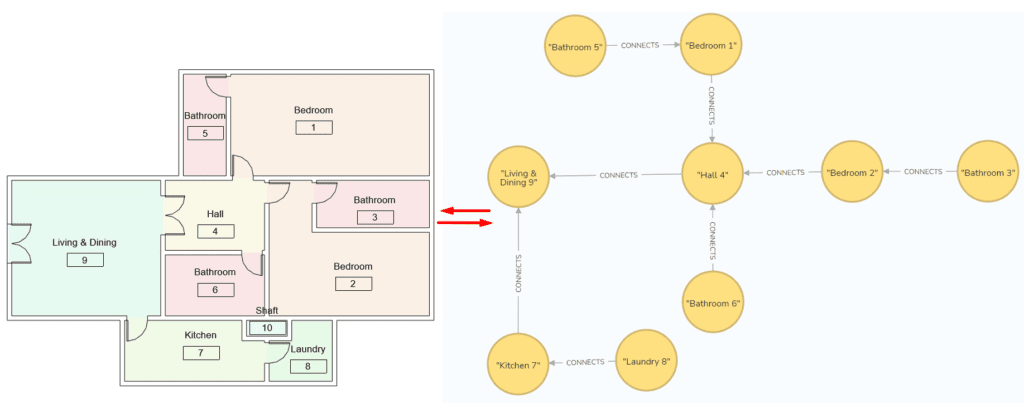
Image caption: Revit model’s room and its relationships in the Neo4j database
Neo4j offers a lot of different metrics from graph theory as tools to analyze data. For now, we’ll focus on two of them, the Shortest Path, under the Path Finding measures umbrella, and the Degree Centrality, which is the most elementary of the Centrality Measures.
- Degree Centrality
Degree centrality is the simplest centrality measure [5]. It determines the size of the network for a node and is considered a local measure since it is information related only to the node itself and not to the network or graph as a whole like the other centrality measures do.
This metric measures the number of incoming/outgoing relationships from each node of the graph, which means that the node with the biggest degree centrality is the most popular node within a graph since it has the largest number of connections and stands in a privileged position in the network.
In AEC terms, this metric is useful to identify the main elements inside of a complex and large network or system, which, for example, should be monitored carefully, since its operation is vital for the whole system. For instance, inside an electrical system, it can identify the cable that feeds the major number of electrical devices, or in a hydraulic system, recognize the pipe or hydraulic pump that is responsible to supply the major number of plumbing device elements.
In our example, the degree centrality should represent the number of rooms that each room is connected to, exposing the room that connects the major number of ambiances. To calculate this metric using Neo4j, we’ll need to install the Neo4j Graph Data Science (GDS) library, and the easier way to achieve this is through the Neo4j Desktop client, by the following steps:
- Download and Install the Neo4j Desktop;
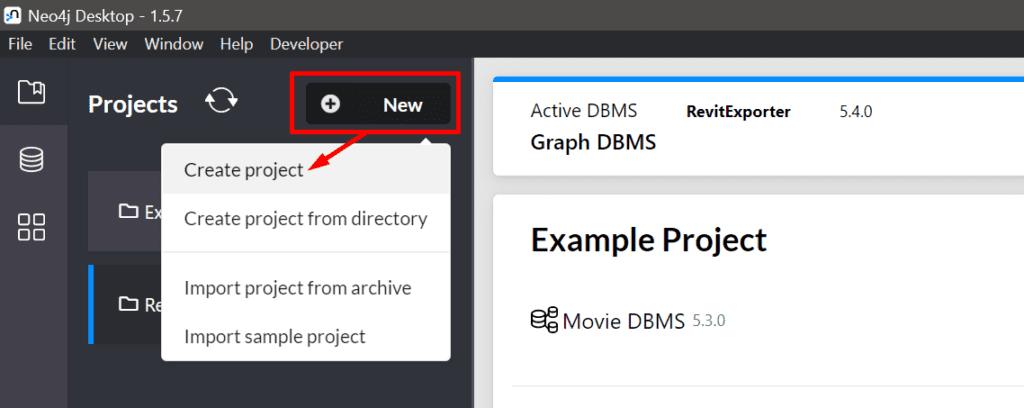
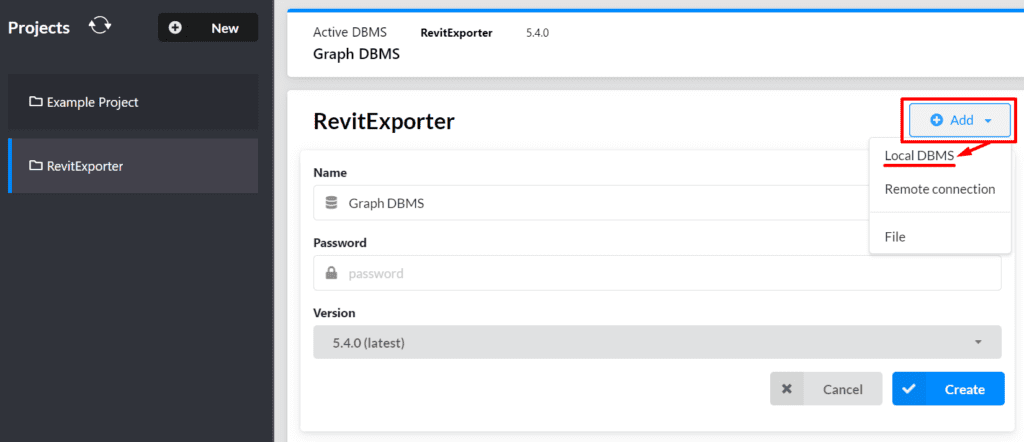
- Create a new project inside the Neo4j Desktop as follows:
3. Add a local Database Management System (DBMS):
4. Go to the plug-ins tab and install the Neo4j Graph Data Science (GDS) library:
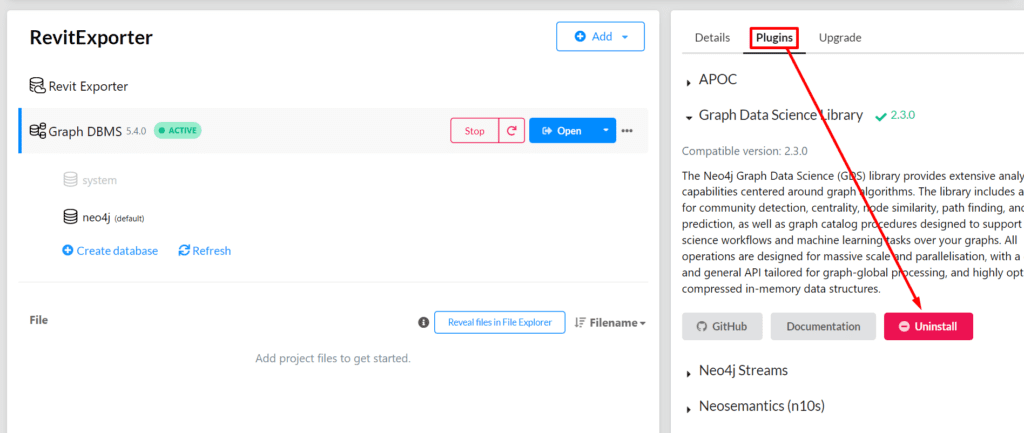
5. Start your Graph DBMS in the Neo4j Desktop;
6. Update your Program.cs file into your Revit add-in solution with the Graph DBMS credentials (user, password, and bolt port) and build the solution in Debug mode;
7. Run your Revit add-in with the fresher .dlls;
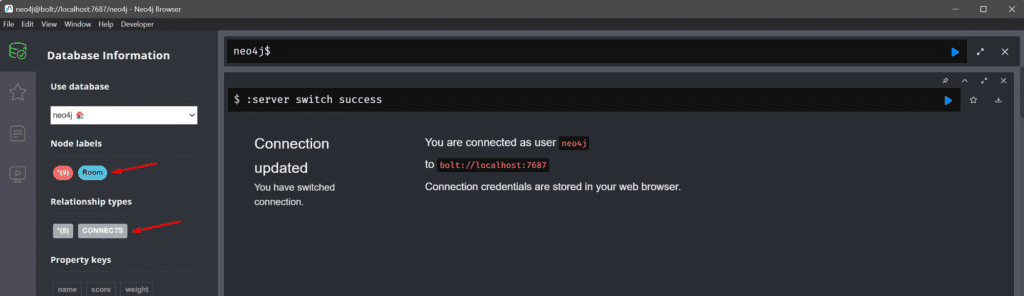
8. Open your Graph DBMS in the Neo4j Desktop;
9. Be sure you have your Revit model’s room data pushed for your local database:
After doing this, it is time to calculate the degree centrality of your network by the following steps:
- In the query tab, create a new GDS graph project with the following Cypher code:
					CALL gds.graph.project(
  'RevitToNeo4j',
  'Room',
  {
    CONNECTS: {
      orientation: 'UNDIRECTED',
      properties: ['score']
    }
  }
)
2. Create a new table to calculate the Degree Centrality of your GDS graph project as follows:
					CALL gds.degree.stream('RevitToNeo4j')
YIELD nodeId, score
RETURN gds.util.asNode(nodeId).name AS name, score AS connections
ORDER BY connections DESC, name DESC
3. As a result, you will see a table like the following that shows the rooms from your model and the corresponding number of connections they have in descending order:
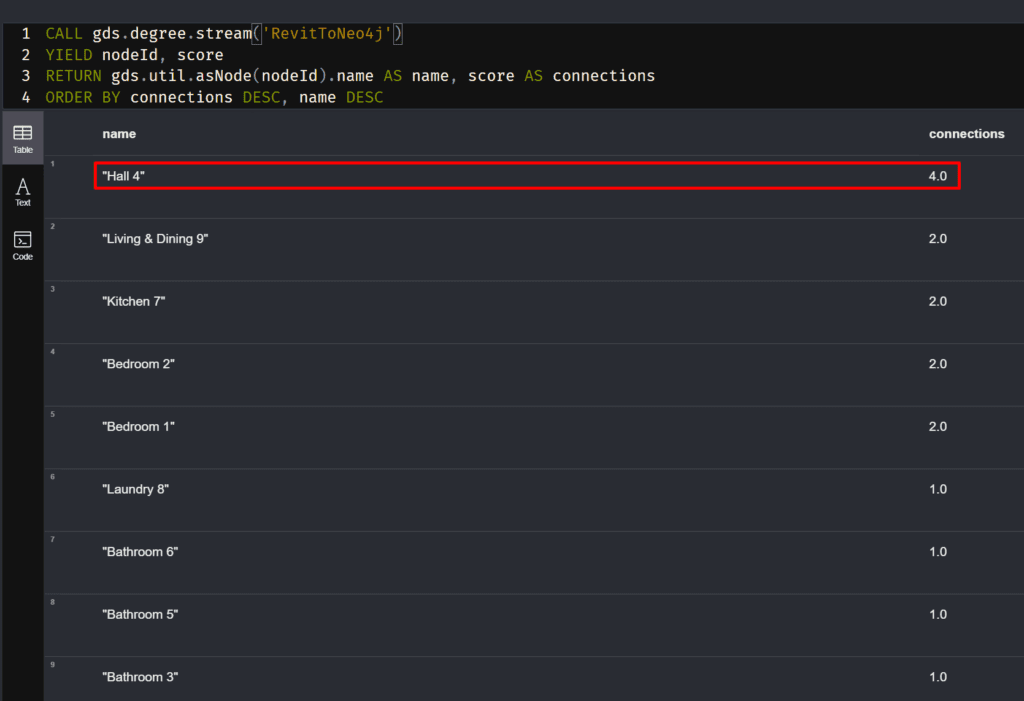
Notice that ‘Hall 4’ has the highest centrality of the example model. Since it is a ‘Hall’, we could predict that this would be the result. After all, there is a tendency for Halls to connect more rooms than any other. However, Imagine that we didn’t know that the Hall is the Hall, so maybe with this information, we could deduce that without even seeing the model, and here is a few things that we can do with the centrality measures, the more data and boundaries we give to our graph, the more we can understand and classify our models without the model itself.
- Shortest path
Also known as graph geodesic in graph theory, the shortest path represents the shortest distance between two points in the graph network. Nevertheless, this information can mean much more than just that, as it can be helpful to define, for example, the better exit route in a fire protection project or the material supply routes planning for construction sites if we add some more restrictions to define the route.
To illustrate the usage of the shortest path, we can leverage the Dijkstra Shortest Path algorithm that computes the shortest path between nodes in weighted graphs. To make it possible we can take advantage of our Revit model by adding, for example, a balcony on it, creating more than just one possible route between two rooms (e.g. ‘Laundry 8’ and ‘Balcony 11’) and adding the ‘distance’ property value between them for each connection. The expected graph for the model after those changes is as follows:
After doing those changes on the Revit model layout, you will need to realize some additional changes on the add-in code as well, by the following steps:
- Add the ‘Distance’ property to the ConnectedRoom class:
public double Distance { get; set; }
2. Calculate and store the distance among rooms by the following code into the ParseRooms method, on the RevitToNeo4j.cs file:
					private static void ParseRooms(Document doc)
        {
            Doors = GetDoors(doc);
            Rooms = GetRooms(doc);
            ConnectedRooms = new Dictionary<string, List<ConnectedRoom>>();

            foreach (var room in Rooms)
            {
                List<ConnectedRoom> connectedRooms = new List<ConnectedRoom>();

                var roomPoint = GetPoint(room);

                //get the rooms that connect with this one
                var connectedRoomNames = Doors
                    .Where(a => a.ToRoom != null && a.FromRoom != null && a.ToRoom.Id == room.Id)
                    .Select(a => a.FromRoom)
                    .ToList();

                foreach (var cr in connectedRoomNames)
                {
                    var connectedRoomPoint = GetPoint(cr);
                    var distance = Math.Round(roomPoint.DistanceTo(GetPoint(cr)), 3);
                    connectedRooms.Add(new ConnectedRoom { Distance = distance, Name = cr.Name });
                }

                ConnectedRooms.Add(room.Name, connectedRooms);
            }
        }
3. Add the following GetPoint() into the RevitToNeo4j.cs file:
					private static XYZ GetPoint(Room room)
        {
            LocationPoint lp = room.Location as LocationPoint;
            return lp.Point;
        }
4. Replace the query inside the CreateRelationship() method into the Program.cs file with the following code to make our graph bidirectional and to compute the distance property to the connections:
					var query = @"
                MERGE (p1:Room { name: $room1Name})
                MERGE (p2:Room { name: $room2Name})
                MERGE (p1)-[:CONNECTS { score: $distance }]->(p2)
                MERGE (p2)-[:CONNECTS { score: $distance }]->(p1)
                RETURN p1, p2";
5. Add the ‘distance’ variable as a parameter in the RunAsync() method into the Program.cs file as well:
					var result = await tx.RunAsync(query, new { room1Name, room2Name, distance });
return await result.ToListAsync();
Having done that, you can proceed by creating your graph on the Neo4j side and returning the shortest path between rooms considering the distance between them.
To calculate this metric using Neo4j, you can leverage your Graph DBMS instance in the Neo4j Desktop already started. To clean up your DB, you can use the following code (notice this will delete everything inside your instance, so be careful with it):
					MATCH (n)
DETACH DELETE n
Having everything set up, you can proceed to the following steps:
- Inside the Neo4j environment, create the ‘ShorthestPathGraph’ graph, by the following query:
					CALL gds.graph.project(
    'RevitToNeo4j',
    'Room',
    'CONNECTS',
    {
        relationshipProperties: 'score'
    }
)
2. Retrieve the shortest path between two rooms considering the shortest distance by the following query, which we expect to see the shortest path between ‘Laundry 8’ and ‘Balcony 11’:
					MATCH (source:Room {name: 'Laundry 8'}), (target:Room {name: 'Balcony 11'})
CALL gds.shortestPath.dijkstra.stream('RevitToNeo4j', {
    sourceNode: source,
    targetNode: target,
    relationshipWeightProperty: 'score'
})
YIELD index, sourceNode, targetNode, totalCost, nodeIds, costs, path
RETURN
    index,
    gds.util.asNode(sourceNode).name AS sourceNodeName,
    gds.util.asNode(targetNode).name AS targetNodeName,
    totalCost,
    [nodeId IN nodeIds | gds.util.asNode(nodeId).name] AS nodeNames,
    costs,
    nodes(path) as path
ORDER BY index
3. Finally, you will have the following result, showing the shortest path between the rooms. Notice that you can choose between the graph representation and the table as well, where it also shows the total cost of the path, the nodes that participate in the path, and its particular costs as follows:
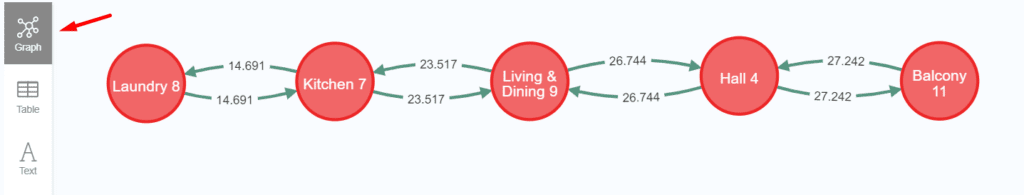
Notice that the algorithm is considering the path which has the lower cost, since we could go to ‘Balcony 11’ leaving from ‘Laundry 8’, by passing through both Bedrooms 1 or 2, but both will be a long path to go through in distance terms.
What else can we do using graph databases?
Graph theory has dozens of metrics, and the Neo4j database offers several. Moreover, there are other graph databases we can leverage to explore. BIM models store a huge amount of data that can be leveraged to understand, analyze and predict information from the building project through those metrics.
Centrality measures can detect the influence a node has over the flow of information in a graph (Betweenness Centrality) or identify the nodes that best spread information through the network (Closeness Centrality). In AEC terms, those metrics can be used, for example, to hierarchize a set of clash detection report causes and the elements involved in it or measure the collaboration among teams.
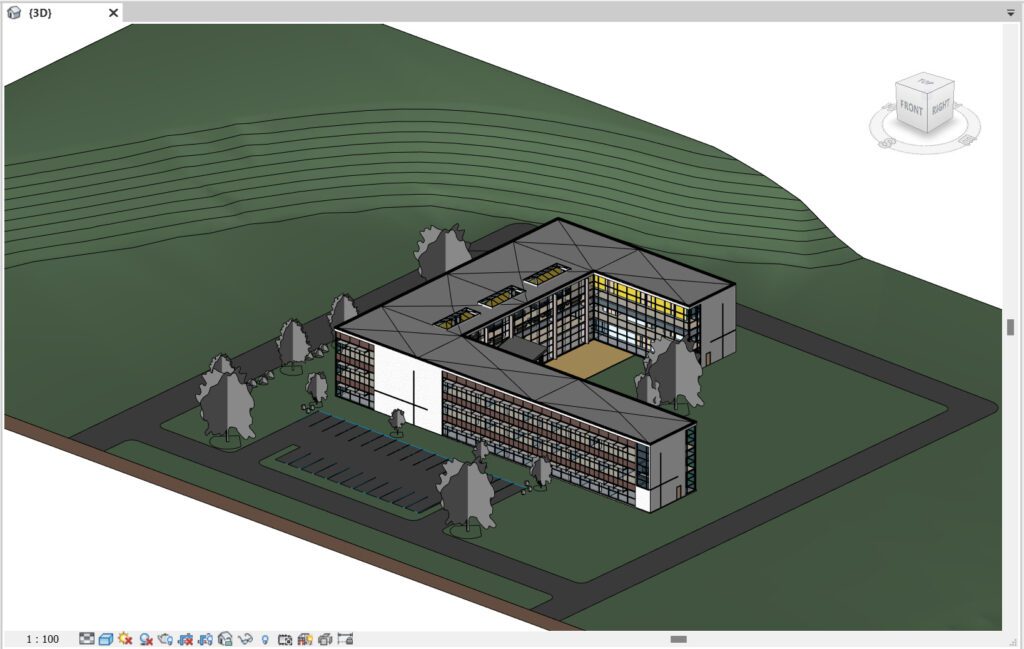
Community detection algorithms can be used to identify and measure the tendency of clustering in a graph-based network. In AEC terms, it could identify a highly dependent subsystem of elements inside a model. As an example, we can use the following Revit model:
By extracting their rooms relationships as we did previously, we can easily identify a lot of clusters in the graph network, like the highlighted one:
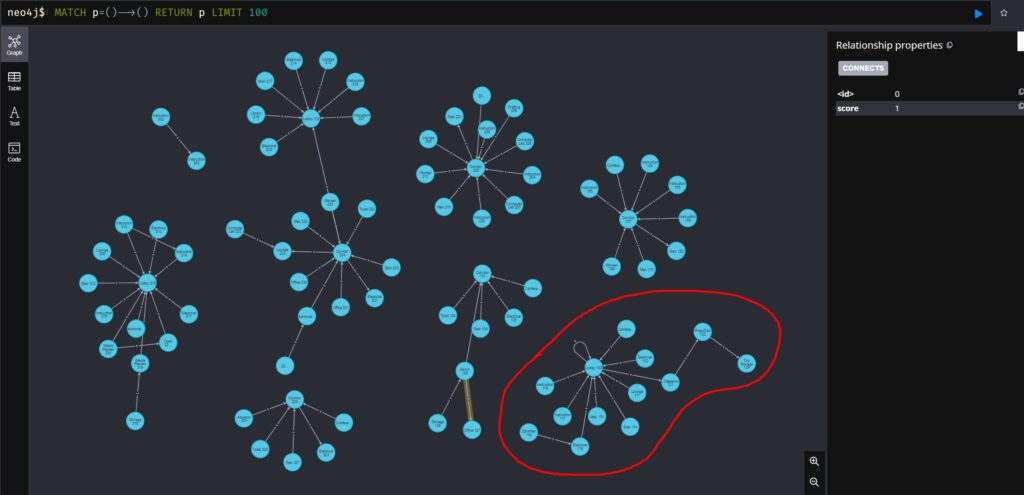
Performing a visual analysis of the graph, we can assume that the clusters can represent, for example, a set of rooms that don’t connect, like rooms from different levels, or rooms in which, at least, the connection between is not made through a door.
What’s more, Neo4j has a Machine Learning pipeline to predict the classes of unknown nodes leveraging the properties of the other nodes from the same network, which expands the boundaries of usage of graph databases in the AEC industry by allowing studies in terms of spaces recognition, layouts optimization, exit routes finding, and others.
Conclusion
The increasing usage of digital construction models that simulate the real behavior of construction elements has generated a massive production of data, whose discretization and interpretation can be an arduous task without the usage of suitable artifacts.
Graph databases can become essential in this process since they allow the mapping of different layers of relationships between these elements, obtaining data in a flexible and wide-ranging way.
We were able to understand in practice how to obtain data from digital construction models using graph databases and how we can relate the results obtained to carry out analyses in the real world, but this is just the tip of the iceberg.
The universe of graph theory and its applications in the AEC industry is wide, so stay tuned for the next steps of this investigation, and let us know what you would like to see about graph databases, such as Neo4j or others, in the AEC industry as well!
References

Valentin Noves
I'm a versatile leader with broad exposure to projects and procedures and an in-depth understanding of technology services/product development. I have a tremendous passion for working in teams driven to provide remarkable software development services that disrupt the status quo. I am a creative problem solver who is equally comfortable rolling up my sleeves or leading teams with a make-it-happen attitude.